UNITED STATES
SECURITIES AND EXCHANGE COMMISSION
Washington, D.C. 20549
______________________________
FORM 10-K
______________________________
ANNUAL REPORT PURSUANT TO SECTION 13 OR 15(d) OF THE SECURITIES EXCHANGE ACT OF 1934
For the Fiscal Year Ended: December 31, 2010
Commission File Number 001-34506
______________________________
TWO HARBORS INVESTMENT CORP.
(Exact Name of Registrant as Specified in Its Charter)
| | |
Maryland | | 27-0312904 |
(State or Other Jurisdiction of Incorporation or Organization) | | (I.R.S. Employer Identification No.) |
| | |
601 Carlson Parkway, Suite 330 Minnetonka, Minnesota | | 55305 |
(Address of Principal Executive Offices) | | (Zip Code) |
(612) 238-3300
(Registrant's Telephone Number, Including Area Code)
Securities Registered Pursuant to Section 12(b) of the Act:
| | |
Title of Each Class: | | Name of Exchange on Which Registered: |
Common Stock, par value $0.01 per share | | New York Stock Exchange |
Warrants to purchase Common Stock | | NYSE Amex |
Securities registered pursuant to Section 12(g) of the Act: None
Indicate by check mark if the registrant is a well-known seasoned issuer, as defined in Rule 405 of the Securities Act. Yes o No x
Indicate by check mark if the registrant is not required to file reports pursuant to Section 13 or Section 15(d) of the Act. Yes o No x
Indicate by check mark whether the registrant (1) has filed all reports required to be filed by Section 13 or 15(d) of the Securities Exchange Act of 1934 during the preceding 12 months (or for such shorter period that the registrant was required to file such reports), and (2) has been subject to such filing requirements for the past 90 days. Yes x No o
Indicate by check mark whether the registrant has submitted electronically and posted on its corporate Web site, if any, every Interactive Data File required to be submitted and posted pursuant to Rule 405 of Regulation S-T (§232.405 of this chapter) during the preceding 12 months (or for such shorter period that the registrant was required to submit and post such files). Yes o No o
Indicate by check mark if disclosure of delinquent filers pursuant to Item 405 of Regulation S-K (§229.405 of this chapter) is not contained herein, and will not be contained, to the best of registrant's knowledge, in definitive proxy or information statements incorporated by reference in Part III of this Form 10-K or any amendment to this Form 10-K. x
Indicate by check mark whether the registrant is a large accelerated filer, an accelerated filer, a non-accelerated filer or smaller reporting company. See the definitions of “large accelerated filer,” “accelerated filer” and “smaller reporting company” in Rule 12b-2 of the Exchange Act. (Check one):
| | | | | | |
Large accelerated filer o | | Accelerated filer x | | Non-accelerated filer o | | Smaller reporting company o |
Indicate by check mark whether the registrant is a shell company (as defined in Rule 12b-2 of the Act). Yes o No x
As of June 30, 2010, the aggregate market value of the registrant’s common stock held by non-affiliates of the registrant was $212.7 million based on the closing sale price as reported on the NYSE Amex on that date.
As of March 4, 2011 there were 40,501,246 shares of outstanding common stock, par value $.01 per share, issued and outstanding.
DOCUMENTS INCORPORATED BY REFERENCE
Portions of the registrant's definitive Proxy Statement for the 2011 Annual Meeting of Stockholders, which will be filed with the Securities and Exchange Commission under Regulation 14A within 120 days after the end of registrant's fiscal year covered by this Annual Report, are incorporated by reference into Part III.
TWO HARBORS INVESTMENT CORP.
2010 ANNUAL REPORT ON FORM 10-K
TABLE OF CONTENTS
| | | |
| | | Page |
PART I | | | |
| | | |
| | | |
| | | |
| | | |
| | | |
| | | |
PART II | | | |
| | | |
| | | |
| | | |
| | | |
| | | |
| | | |
| | | |
| | | |
PART III | | | |
| | | |
| | | |
| | | |
| | | |
| | | |
PART IV | | | |
| | | |
| | |
PART I
Item 1. Business
Overview
Our Company
Two Harbors Investment Corp. is a Maryland corporation focused on investing in, financing and managing residential mortgage-backed securities, or RMBS, and related investments, which we collectively refer to as our target assets. We operate as a real estate investment trust, or REIT, as defined under the Internal Revenue Code of 1986, as amended, or the Code.
We were incorporated on May 21, 2009 and commenced operations as a publicly traded company on October 28, 2009, upon completion of a merger with Capitol Acquisition Corp. At the closing of the merger, after deducting transaction costs and payments to Capitol stockholders, we had approximately $124.0 million in cash available to fund investments and operations. In 2010, we completed two follow-on public offerings issuing a total of 27.1 million shares of our common stock for proceeds, net of the underwriters' discount and other offering costs, of approximately $235.3 million.
The terms “Two Harbors,” “we,” “our,” “us” and the “Company” refer to Two Harbors Investment Corp. and its subsidiaries as a consolidated entity. The term “Capitol” refers to Capitol Acquisition Corp., which became a wholly-owned indirect subsidiary of Two Harbors after completion of the merger transaction as described below in the "Formation of Two Harbors Investment Corp." section of this document. Upon completion of the merger transaction, Capitol was considered the accounting acquirer, similar to a reverse merger. As the surviving entity for accounting purposes, Capitol's financial information for the year ended December 31, 2008 is presented in this Annual Report on Form 10-K on a historical carryover basis.
Our objective is to provide attractive risk-adjusted returns to our stockholders over the long term, primarily through dividends and secondarily through capital appreciation. We selectively acquire and manage an investment portfolio of our target assets, which is constructed to generate attractive returns through market cycles. We focus on security selection and implement a relative value investment approach across various sectors within the residential mortgage market. Our target assets include the following:
| |
• | Agency RMBS, meaning RMBS whose principal and interest payments are guaranteed by the Government National Mortgage Association (or Ginnie Mae), the Federal National Mortgage Association (or Fannie Mae), or the Federal Home Loan Mortgage Corporation (or Freddie Mac); |
| |
• | Non-Agency RMBS, meaning RMBS that are not issued or guaranteed by Ginnie Mae, Fannie Mae or Freddie Mac; and |
| |
• | Financial assets other than RMBS, comprising approximately 5% to 10% of the portfolio. |
We seek to deploy moderate leverage as part of our investment strategy. We generally finance our target assets through short-term borrowings structured as repurchase agreements.
We recognize that investing in our target assets is competitive and that we compete with other investment vehicles for attractive investment opportunities. We rely on our management team and Pine River Capital Management, or Pine River (described below), who have developed strong relationships with a diverse group of financial intermediaries, to execute on our investment approach. In addition, we have benefited and expect to continue to benefit from Pine River's analytical and portfolio management expertise and infrastructure. We believe that our significant focus on the RMBS area, the extensive RMBS expertise of our investment team, our strong analytics and our disciplined relative value investment approach give us a competitive advantage over our peers.
We have elected to be treated as a REIT for U.S. federal income tax purposes. To qualify as a REIT, we are required to meet certain investment and operating tests and annual distribution requirements. We generally will not be subject to U.S. federal income taxes on our taxable income to the extent that we annually distribute all of our net taxable income to stockholders, do not participate in prohibited transactions and maintain our intended qualification as a REIT. However, certain activities that we may perform may cause us to earn income which will not be qualifying income for REIT purposes. We have designated our subsidiary, Capitol, as a taxable REIT subsidiary, or TRS, as defined in the Code, to engage in such activities, and we may in the future form additional TRSs. We also intend to operate our business in a manner that will permit us to maintain our exemption from registration under the Investment Company Act of 1940, as amended, or the 1940 Act.
Our Manager
We are externally managed and advised by PRCM Advisers LLC, a wholly-owned subsidiary of Pine River Capital Management L.P., or Pine River. Founded in 2002, with offices in New York, London, Hong Kong, San Francisco and Minnetonka, Minnesota, Pine River is a global multi-strategy asset management firm providing comprehensive portfolio
management, transparency and liquidity to institutional and high net worth investors.
Pine River formed PRCM Advisers for the purpose of providing management services to us. PRCM Advisers is responsible for administering our business activities and day-to-day operations. Pursuant to the terms of a management agreement between us and PRCM Advisers, PRCM Advisers provides us with our management team, including our officers, along with appropriate support personnel. In addition, PRCM Advisers provides us with the expertise of Pine River’s fixed income team, proprietary analytical tools and appropriate fund infrastructure. PRCM Advisers is at all times subject to the supervision and oversight of our board of directors. Each of our officers is an employee or partner of Pine River. We do not have any employees. We do not pay any of our officers any cash compensation. Rather, we pay PRCM Advisers a 1.5% annual base management fee pursuant to the terms of the management agreement. We also reimburse PRCM Advisers the allocable share of the compensation paid by PRCM Advisers to its personnel serving as our principal financial officer and general counsel and other reimbursable costs under the management agreement and shared facilities and services agreement. We do not pay PRCM Advisers any incentive-based fees or other incentive-based compensation.
Through our relationship with PRCM Advisers, we benefit from Pine River’s disciplined and highly analytical investment approach, extensive long-term relationships in the financial community, and established infrastructure. Pine River’s disciplined investment approach utilizes a cross-product approach, conducting top-down market assessments with respect to various subsets of the RMBS market in order to identify the most attractive segments and investment opportunities. Our security selection process leverages proprietary and third party analytic tools to conduct a detailed analysis of factors that influence our target assets. We select our RMBS based on factors that include extensive analysis of the underlying loans, including prepayment trends, average remaining life, amortization schedules, fixed versus floating interest rates, geographic concentration, property type, loan-to-value ratios, and credit scores, among others.
Pine River’s fixed income team has broad experience in managing Agency RMBS, non-Agency RMBS and other mortgage-related assets through a variety of credit and interest rate environments and has demonstrated the ability to generate attractive risk-adjusted returns under different market conditions and cycles, on both a levered and unlevered basis. Pine River maintains extensive long-term relationships with financial intermediaries including prime brokers, investment banks, broker-dealers and asset custodians. These relationships enhance PRCM Advisers’ ability to source, finance, protect and hedge our investments and, thus, enable us to succeed in various credit and interest rate environments. We also benefit from Pine River’s comprehensive finance, operational and administrative infrastructure, including its risk management and accounting operations, as well as its legal, compliance and software development teams.
As of December 31, 2010, Pine River had net assets under management, including the Two Harbors stockholders’ equity, of approximately $3.4 billion, of which approximately $2.0 billion is dedicated to mortgage strategies. Pine River employs over 100 employees globally, including 39 investment professionals, and has successfully maintained low employee attrition.
Formation of Two Harbors Investment Corp.
Capitol Acquisition Corp. (prior to October 28, 2009)
Capitol was a blank check company formed under the laws of the State of Delaware on June 26, 2007 to effect a merger, capital stock exchange, asset acquisition, stock purchase, reorganization or similar business combination with one or more businesses or assets.
On November 14, 2007, Capitol completed its initial public offering of 25,000,000 units at a price of $10.00 per unit, and received net proceeds of approximately $239.8 million. Capitol received additional net proceeds of $12.0 million on December 12, 2007, as a result of the initial public offering underwriters exercising their over-allotment option to purchase an additional 1,249,000 units. Each unit consisted of one share of Capitol's common stock and one redeemable common stock purchase warrant. Each warrant entitled the holder to purchase from Capitol one share of common stock at an exercise price of $7.50, commencing the later of the completion of a business combination or November 8, 2008 and expiring November 8, 2012. Certain of Capitol's sponsors and founding stockholders, or the Initial Stockholders, purchased an additional 7,000,000 warrants for $7.0 million. The purchase and issuance of these warrants occurred simultaneously with consummation of the IPO on a private placement basis. All of the net proceeds received from the foregoing sale of securities, totaling approximately $258.4 million, were placed in a trust account pursuant to Capitol's charter, pending consummation of a business combination.
On June 11, 2009, Capitol signed an Agreement and Plan of Merger with Two Harbors, Two Harbors Merger Corp. and Pine River which sets forth the terms and conditions whereby Capitol agreed to merge into Two Harbors Merger Corp., with Capitol being the surviving entity and becoming a wholly-owned subsidiary of Two Harbors.
Consummation of the Merger Transaction
On October 26, 2009, the majority of Capitol's stockholders approved the merger transaction, and the transaction closed on October 28, 2009. In connection with the closing, the holders of Capitol's common stock and warrants became holders of the securities of Two Harbors after the merger in the same proportion as their holdings in Capitol immediately
before the merger, except as (i) increased by (A) the cancellation of 6,562,257 shares of Capitol common stock held by the Initial Stockholders, (B) conversion of 6,875,130 shares of Capitol common stock by holders thereof who exercised the right to have their shares converted into funds held in the trust account at a value of $9.87 per share and (C) the purchase of 5,994,661 shares pursuant to forward sales agreements that provided for Capitol to purchase such shares after the closing of the merger at a price of $9.87 per share and (ii) decreased by the issuance of 22,159 shares of restricted stock to our independent directors at the closing.
In addition, in connection with the closing of the merger transaction, we entered into a supplement and amendment to the agreement that governs the warrants, the terms of which, among other things, (i) increased the exercise price of the warrants from $7.50 per share to $11.00 per share, (ii) extended the expiration date of the warrants from November 7, 2012 to November 7, 2013 and (iii) limited a holder's ability to exercise warrants to ensure that such holder's Beneficial Ownership or Constructive Ownership (each as defined in our charter) do not exceed the restrictions contained in the charter limiting the ownership of shares of our common stock.
Two Harbors Investment Corp. (post-merger)
As of October 28, 2009, upon consummation of the merger agreement, we commenced doing business as Two Harbors Investment Corp. Our common stock is listed on the NYSE under the symbol TWO and our warrants are listed on the NYSE Amex under the symbol TWO.WS.
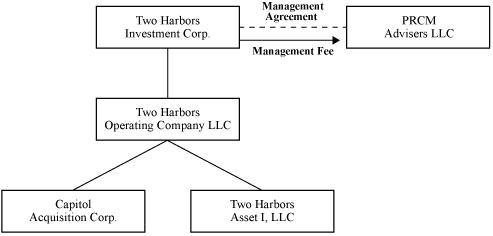
The following chart shows our structure. We conduct substantially all of our operations through our wholly-owned subsidiary, Two Harbors Operating Company LLC, or the Subsidiary LLC. The Subsidiary LLC in turn conducts its business through two subsidiaries: Two Harbors Asset I, LLC, which holds most of our RMBS and other assets; and Capitol, which we have elected to treat as a TRS, and which holds certain non-RMBS assets and conducts certain economic hedging activity.
Our Business
Our Investment Strategy
Our investment objective is to provide attractive risk-adjusted returns to our stockholders over the long-term, primarily through dividends and secondarily through capital appreciation. We intend to achieve this objective by constructing a well-balanced portfolio consisting primarily of RMBS, with a focus on managing various associated risks, including interest rate, prepayment, mortgage spread and financing risk. Consistent with the objective of achieving attractive risk-adjusted returns over various market cycles, PRCM Advisers intends to maintain a balanced approach to these various risks.
We rely on PRCM Advisers’ expertise in identifying assets within our target asset classes. PRCM Advisers makes investment decisions based on a rigorous security selection process that takes into consideration a variety of factors, including expected cash yield, risk-adjusted returns, current and projected credit fundamentals, current and projected macroeconomic considerations, current and projected supply and demand, credit and market risk concentration limits, liquidity, cost of financing and financing availability. In all cases, we select securities in such a way as to maintain our REIT qualification and our exemption from registration under the 1940 Act.
Our Target Assets
Our target asset classes and the principal assets are as follows:
| | |
Agency RMBS | Agency RMBS collateralized by either fixed rate mortgage loans, adjustable rate mortgage loans or hybrid mortgage loans, or derivatives thereof, including: |
| ü | mortgage pass-through certificates; |
| ü | collateralized mortgage obligations; |
| ü | Freddie Mac gold certificates; |
| ü | Fannie Mae certificates; |
| ü | Ginnie Mae certificates; |
| ü | “to-be-announced” forward contracts, or TBAs, which are pools of mortgages with specific investment terms to be issued by GSEs at a future date; and |
| ü | interest-only and inverse interest-only securities. |
Non-Agency RMBS | Non-Agency RMBS collateralized by prime mortgage loans, Alt-A mortgage loans, pay-option ARM mortgage loans, and subprime mortgage loans, which may have fixed rate, adjustable rate or hybrid rate terms. |
| Non-Agency RMBS includes both senior and mezzanine RMBS. Senior RMBS refers to non-Agency RMBS that represent the senior-most tranches — that is, the tranches which have the highest priority claim to cash flows from the related collateral pool, within the RMBS structure. Mezzanine RMBS refers to subordinated tranches within the collateral pool. The non-Agency RMBS we purchase may include investment-grade and non-investment grade classes, including non-rated securities. |
| Hybrid mortgage loans have terms with interest rates that are fixed for a specified period of time and, thereafter, generally adjust annually to an increment over a specified interest rate index. ARMs refer to hybrid and adjustable-rate mortgage loans which typically have interest rates that adjust annually to an increment over a specified interest rate index. |
Assets other than RMBS | Non-real estate financial assets including asset-backed securities and certain hedging transactions that may produce non-qualifying income for purposes of the REIT gross income tests. |
Our Investment Activities
At December 31, 2010, we had total assets of approximately $1.8 billion, of which $1.4 billion, or 75.4%, represented our RMBS portfolio. At December 31, 2010, $1.0 billion, or 75.0%, of our RMBS portfolio was comprised of Agency RMBS, $268.2 million, or 19.8%, of our RMBS portfolio was comprised of senior non-Agency RMBS, and the remaining $69.8 million, or 5.2%, was comprised of other non-Agency RMBS. The remaining $443.0 million of assets consisted primarily of U.S. Treasuries classified as trading instruments, cash, restricted cash, receivables and prepaid assets.
Our Investment Guidelines
Our board of directors has adopted the following investment guidelines:
| |
• | no investment shall be made that would cause us to fail to qualify as a REIT for U.S. federal income tax purposes; |
| |
• | no investment shall be made that would cause us to be regulated as an investment company under the 1940 Act; |
| |
• | we will primarily invest within our target assets, consisting primarily of Agency RMBS and non-Agency RMBS; approximately 5% to 10% of our portfolio may include financial assets other than RMBS; and |
| |
• | until appropriate investments can be identified, we will invest available cash in interest-bearing and short-term investments that are consistent with (i) our intention to qualify as a REIT, and (ii) our exemption from investment company status under the 1940 Act. |
These investment guidelines may be changed from time to time by our board of directors without the approval of our stockholders.
Within the constraints of the foregoing investment guidelines, PRCM Advisers has broad authority to select, finance and manage our investment portfolio. As a general matter, our investment strategy is designed to enable us to:
| |
• | build an investment portfolio consisting of Agency RMBS and non-Agency RMBS that will generate attractive returns while having a moderate risk profile; |
| |
• | manage financing, interest, prepayment rate and credit risks; |
| |
• | capitalize on discrepancies in the relative valuations in the mortgage market; and |
| |
• | provide regular quarterly distributions to stockholders. |
Within the requirements of the investment guidelines, PRCM Advisers makes determinations as to the percentage of our assets that will be invested in each of our target assets. PRCM Advisers' decisions depend on prevailing market conditions and may change over time in response to opportunities available in different interest rate, economic and credit environments. As a result, we cannot predict the percentage of our assets that will be invested in any of our target asset classes at any given time. We believe that the diversification of our portfolio of assets and the flexibility of our strategy, combined with PRCM Advisers' and its affiliates' expertise, will enable us to achieve attractive risk-adjusted returns under a variety of market conditions and economic cycles.
Financing Strategy
We deploy moderate leverage to increase potential returns to our stockholders and to fund the acquisition of our assets. We are not required to maintain any particular leverage ratio. The amount of leverage we deploy for particular investments in our target assets depends upon an assessment of a variety of factors, which may include the anticipated liquidity and price volatility of our assets; the gap between the duration of assets and liabilities, including hedges; the availability and cost of financing the assets; our opinion of the credit worthiness of financing counterparties; the health of the U.S. economy and residential mortgage-related markets; our outlook for the level, slope, and volatility of interest rates; the credit quality of the loans underlying our Agency RMBS and non-Agency RMBS; and our outlook for asset spreads relative to the London Interbank Offered Rate, or LIBOR, curve.
Our primary financing sources are repurchase agreements. We may use repurchase agreements to deploy, on a debt-to-equity basis, up to ten times leverage on our Agency RMBS assets, but we are not required to maintain any particular leverage ratio. We expect under current market conditions to deploy limited leverage on our non-Agency RMBS through the use of repurchase agreements.
Repurchase agreements are financings pursuant to which one party, the seller or borrower, sells assets to the repurchase agreement counterparty, the buyer or lender, for an agreed price with the obligation to repurchase the assets from the buyer at a future date and at a price higher than the original purchase price. The amount of financing available under a repurchase agreement is limited to a specified percentage of the estimated market value of the assets. The difference between the sale price and repurchase price is the interest expense of financing under a repurchase agreement. Under repurchase agreement financing arrangements, if the value of the collateral decreases, the buyer could require the seller to provide additional cash collateral to re-establish the ratio of value of the collateral to the amount of borrowing. In the current economic climate, lenders under repurchase agreements generally advance approximately 90% to 97% of the market value of the Agency RMBS financed (meaning a 3% to 10% discount from market value, or haircut) and 50% to 75% of the market value of the non-Agency RMBS financed (meaning a 25% to 50% haircut). A significant decrease in advance rate or an increase in the haircut could result in our having to sell securities in order to meet additional margin requirements by the lender. We expect to mitigate our risk of margin calls under repurchase agreements by deploying a prudent amount of leverage that is below what could be used under current advance rates.
In order to reduce our exposure to counterparty-related risk, we generally seek to diversify our exposure by entering into repurchase agreements with multiple counterparties. At December 31, 2010, we had $1.2 billion of outstanding balances under repurchase agreements with 10 counterparties, with a maximum net exposure (the difference between the amount loaned to us, including interest payable, and the value of the securities pledged by us as collateral, including accrued interest receivable on such securities) to any single lender of $45.1 million, or 12.0% of equity.
Interest Rate Hedging and Risk Management Strategy
We enter into a variety of derivative and non-derivative instruments in connection with our risk management activities. Our primary objective for executing these derivatives and non-derivative instruments is to mitigate our economic exposure to future events that are outside our control. Our derivative financial instruments are utilized principally to manage market risk and cash flow volatility associated with interest rate risk (including associated prepayment risk) related to certain assets and liabilities. As part of our risk management activities, we may, at times, enter into various forward contracts including short securities, agency TBAs, options, futures, swaps and caps. In executing on our current risk management strategy, we have entered into interest rate swap agreements, swaptions and TBA positions. We have also entered into a number of non-derivative instruments to manage interest rate risk, principally U.S. Treasuries and Agency interest-only securities.
Our Competitive Advantages
Our investment strategy is focused on utilizing our underlying core strengths, described below in further detail, which we believe offer competitive advantages in the marketplace:
Significant Experience of Our Management Team
We believe that the extensive experience of our management team and, through our relationship with PRCM Advisers, the officers and employees of Pine River provides us with significant expertise across our target assets. Pine River’s fixed income investment team has managed Agency RMBS, non-Agency RMBS and other mortgage-related assets through a variety of credit and interest rate environments and has demonstrated strong ability to generate attractive risk-adjusted returns under different market conditions, on both a levered and unlevered basis.
The senior members of our research and investment team have an average of 24 years of experience in mortgage-backed securities investing, including experience in performing advisory services for investment banks, funds, other investment vehicles, and other managed and discretionary accounts. Our Co-Chief Investment Officers are Steven Kuhn and William Roth. Mr. Kuhn is a Partner of Pine River, and joined the firm in January 2008. He has 19 years of experience investing in RMBS and other fixed income securities for Goldman Sachs Asset Management, Citadel and Cargill. Mr. Roth joined Pine River in June 2009, and has 30 years of experience working for Salomon Brothers and Citigroup in mortgage-backed and asset-backed securities markets. The fixed income investment team also includes seasoned traders, analysts and risk managers, and is backed by Pine River’s extensive infrastructure in the areas of credit analysis, trade execution, risk management, valuation, accounting, operations, corporate governance and law.
Disciplined Relative Value Investment Approach
Disciplined security selection is a key element of our strategy. We are, in essence, a relative value investor in residential mortgage-backed securities. PRCM Advisers uses a cross-product approach, conducting top-down market assessments with respect to various subsets of the RMBS market in order to identify the most attractive segments and investment opportunities. In employing this detailed analysis, PRCM Advisers seeks to best capture market inefficiencies and identify the most attractive securities. We select our RMBS based on factors that include extensive analysis of the underlying loans, including prepayment trends, average remaining life, amortization schedules, fixed versus floating interest rates, geographic concentration, property type, loan-to-value ratios and credit scores. Considering the multi-trillion dollar size of the U.S. RMBS market, we can be very selective with our investments and buy only the securities we deem to be the most attractive. We believe this holistic, relative-value approach to the non-Agency and Agency RMBS investments may achieve higher risk-adjusted returns than an approach that focuses on a single sector of the residential mortgage market.
Portfolio Construction
Our objective is to provide attractive risk-adjusted returns to our stockholders over the long-term, primarily through dividends and secondarily through capital appreciation. We intend to achieve this objective by constructing a well-balanced portfolio consisting primarily of RMBS, with a focus on managing various associated risks, including interest rate, prepayment, mortgage spread and financing risk. PRCM Advisers uses its fixed income investment team’s expertise across a broad range of asset classes within the RMBS markets to build a portfolio that seeks to balance income, cash, capital appreciation, leverage and the aforementioned risks. Through the careful and disciplined selection of assets, and continual portfolio monitoring, we seek to build and maintain an investment portfolio that provides value to stockholders over time both in absolute terms and relative to other RMBS portfolios.
Access to PRCM Advisers’ Analytical Tools, Infrastructure and Expertise
Our experienced investment team constructs and manages our RMBS investment portfolio through the use of focused qualitative and quantitative analysis, which helps us manage risk on a security-by-security and portfolio basis. We rely on a variety of proprietary and third party analytical tools and models, which we customize to our needs. We focus on in-depth analysis of the numerous factors that influence our target assets, including:
| |
• | fundamental market and sector review; |
| |
• | disciplined security selection; |
| |
• | controlled risk exposure; and |
| |
• | prudent balance sheet management. |
We also use these tools to guide the hedging strategies developed by PRCM Advisers to the extent consistent with the requirements for qualification as a REIT.
In addition, through PRCM Advisers we have access to Pine River’s proprietary technology management platform, called Everest, to track investments and to monitor investment risk across asset classes. Everest collects and stores real-time market data, and integrates market performance with portfolio holdings and proprietary risk models to measure the risk positions in our portfolios. This measurement system portrays overall portfolio risk and risk sources.
Our focus on loan level and local market analysis allows us to track and understand borrower performance, which we consider key in our overall investment strategy. Our ability to track real-time variables such as market specific home prices and
unemployment rates provides us with valuable insights and helps with specific asset selection decisions. We believe that sophisticated analysis of both macro- and micro-economic factors will enable us to manage cash flow and distributions while preserving our stockholders’ capital.
Through a shared facilities and services agreement with Pine River, PRCM Advisers has access to analytical and portfolio management capabilities to aid in security selection and risk management. We capitalize on the market knowledge and ready access to data across our target markets that PRCM Advisers and its affiliates obtain through their established platform. We also benefit, through PRCM Advisers, from Pine River’s comprehensive finance, operational and administrative infrastructure, including its risk management and financial reporting and accounting operations, as well as its business development, legal, compliance, operations, settlement, and software development teams.
Extensive Strategic Relationships and Experience of PRCM Advisers and its Affiliates
PRCM Advisers and its affiliates maintain extensive long-term relationships with financial intermediaries including prime brokers, investment banks, broker-dealers and asset custodians. We believe these relationships enhance our ability to source, finance, protect and hedge our investments and, thus, enable us to succeed in various credit and interest rate environments. Members of the fixed income investment team have many years of experience and well-established contacts within the RMBS industry, and are able to bring their personal relationships to bear for our benefit and the benefit of our stockholders.
Management Agreement
Pursuant to the management agreement between us and PRCM Advisers, PRCM Advisers implements our business strategy and performs certain services for us, subject to oversight by our board of directors. PRCM Advisers is responsible for, among other duties, (i) performing all of our day-to-day functions, (ii) determining investment criteria in conjunction with our board of directors, (iii) sourcing, analyzing and executing investments, asset sales and financings, and (iv) performing asset management duties.
The initial term of the management agreement expires on October 28, 2012, with automatic one-year renewals at the end of the initial term and each term thereafter. Our independent directors review PRCM Advisers' performance annually and, following the initial term, the management agreement may be terminated annually by us without cause upon the vote of at least two-thirds of our independent directors or by a vote of the holders of a majority of the outstanding shares of our common stock, based upon: (i) PRCM Advisers' unsatisfactory performance that is materially detrimental to us or (ii) our determination that the management fees payable to PRCM Advisers are not fair, subject to PRCM Advisers' right to prevent termination based on unfair fees by accepting a reduction of management fees agreed to by at least two-thirds of our independent directors. We are required to provide PRCM Advisers with 180 days' prior notice of such termination. Upon termination without cause, we will pay PRCM Advisers a termination fee, as described below. We will also pay a termination fee to PRCM Advisers if PRCM Advisers terminates the management agreement due to our material breach of such agreement. We may terminate the management agreement with 30 days' prior notice from our board of directors, without payment of a termination fee, for cause, as defined in the management agreement. PRCM Advisers may terminate the management agreement if we become required to register as an investment company under the 1940 Act, with such termination deemed to occur immediately before such event, and may also decline to renew the management agreement by providing us with 180 days' prior notice, in either case of which we would not be required to pay a termination fee.
Base Management Fee
The base management fee paid to PRCM Advisers is 1.5% of our stockholders' equity per annum, calculated and payable quarterly in arrears.
For purposes of calculating the management fee, our stockholders' equity means the sum of the net proceeds from all issuances of our equity securities since inception (allocated on a pro rata daily basis for such issuances during the fiscal quarter of any such issuance), plus our retained earnings at the end of the most recently completed calendar quarter (without taking into account any non-cash equity compensation expense incurred in current or prior periods), less any amount that we have paid for repurchases of our common stock since inception, and excluding any unrealized gains, losses or other items that do not affect realized net income (regardless of whether such items are included in other comprehensive income or loss, or in net income). This amount will be adjusted to exclude one-time events pursuant to changes in accounting principles generally accepted in the United States of America, or GAAP, and certain non-cash items after discussions between PRCM Advisers and our independent directors and approval by a majority of our independent directors. To the extent asset impairments reduce our retained earnings at the end of any completed calendar quarter it will reduce the base management fee for such quarter. Our stockholders' equity for the purposes of calculating the base management fee could be greater than the amount of stockholders' equity shown on the consolidated financial statements.
Expense Reimbursement
We reimburse PRCM Advisers for (i) our allocable share of the compensation paid by PRCM Advisers to its personnel serving as our principal financial officer and general counsel and personnel employed by PRCM Advisers as in-house legal, tax, accounting, consulting, auditing, administrative, information technology, valuation, computer programming and
development and back-office resources to us and (ii) any amounts for personnel of PRCM Advisers' affiliates arising under a shared facilities and services agreement.
Termination Fee
Upon termination of the management agreement by us without cause or by PRCM Advisers due to our material breach of the management agreement, we are required to pay a termination fee equal to three times the sum of the average annual base management fee earned by PRCM Advisers during the 24-month period immediately preceding the date of termination, calculated as of the end of the most recently completed fiscal quarter prior to the date of termination.
Operating and Regulatory Structure
1940 Act Exemption
We conduct our operations so that we are not required to register as an investment company under the 1940 Act. The 1940 Act exempts entities that are “primarily engaged in the business of purchasing or otherwise acquiring mortgages and other liens on and interests in real estate,” or qualifying interests. Under the current interpretation of the SEC's staff, in order to qualify for this exemption, we must maintain (i) at least 55% of our assets in qualifying interests (referred to as the 55% Test) and (ii) at least 80% of our assets in real estate related assets including qualifying interests (referred to as the 80% Test). In meeting the 55% Test, we treat as qualifying interests those RMBS issued with respect to an underlying pool as to which we own all of the certificates issued by the pool. RMBS that do not represent all of the certificates issued (i.e., an undivided interest) by the pool of mortgages (i.e., a whole pool) underlying such RMBS may be treated as securities separate from such underlying mortgage loans and, thus, may not be considered qualifying interests for purposes of the 55% Test; however, such RMBS would be considered real estate related assets for purposes of the 80% Test. Therefore, for purposes of the 55% Test, our ownership of these types of RMBS is limited by the provisions of the 1940 Act. If the SEC or its staff were to adopt a contrary interpretation, we could be required to sell a substantial amount of our RMBS under potentially adverse market conditions. Further, in order to ensure that at all times we qualify for this exemption from the 1940 Act, we may be precluded from acquiring RMBS whose yield is higher than the yield on RMBS that could be otherwise purchased in a manner consistent with this exemption. Accordingly, we monitor our compliance with both the 55% Test and the 80% Test in order to maintain our exempt status under the 1940 Act.
REIT Qualification
We have elected to be taxed as a REIT under the Code, commencing with our taxable period ended December 31, 2009, upon the filing of our federal income tax return for such year. Our qualification as a REIT depends upon our ability to meet on a continuing basis, through actual investment and operating results, various complex requirements under the Code relating to, among other things, the sources of our gross income, the composition and values of our assets, our distribution levels and the diversity of ownership of our shares. We believe that we are organized in conformity with the requirements for qualification and taxation as a REIT under the Code, and we conduct our operations in a manner which will enable us to continue to meet the requirements for qualification and taxation as a REIT.
As long as we continue to qualify as a REIT, we generally will not be subject to U.S. federal income tax on the REIT taxable income we distribute currently to our stockholders. If we fail to qualify as a REIT in any taxable year and do not qualify for certain statutory relief provisions, we will be subject to U.S. federal income tax at regular corporate rates and may be precluded from qualifying as a REIT for the subsequent four taxable years following the year during which we lost our REIT qualification. Even if we qualify for taxation as a REIT, we may be subject to certain U.S. federal, state and local taxes on our income or property.
Corporate Governance
We strive to maintain an ethical workplace in which the highest standards of professional conduct are practiced.
| |
• | Our board of directors is composed of a majority of independent directors. Our Audit, Nominating and Corporate Governance and Compensation Committees are composed exclusively of independent directors. |
| |
• | In order to foster the highest standards of ethics and conduct in all of our business relationships, we have adopted a Code of Business Conduct and Ethics and Corporate Governance Guidelines, which cover a wide range of business practices and procedures that apply to all of our directors, officers and employees. In addition, we have implemented Whistle Blowing Procedures for Accounting and Auditing Matters that set forth procedures by which any officer or employee may raise, on a confidential basis, concerns regarding any questionable or unethical accounting, internal accounting controls or auditing matters with our Audit Committee. |
| |
• | We have an insider trading policy that prohibits any of our directors, officers or employees from buying or selling our common and preferred stock on the basis of material nonpublic information and prohibits communicating material nonpublic information to others. |
| |
• | We have a formal internal audit function, through the current use of an independent, outsourced firm, to further the effective functioning of our internal controls and procedures. Our internal audit plan, which is approved annually by our Audit Committee, is based on a formal risk assessment and is intended to provide management |
and our Audit Committee with an effective tool to identify and address areas of financial or operational concerns and to ensure that appropriate controls and procedures are in place. We have implemented Section 404 of the Sarbanes-Oxley Act of 2002, as amended, or the SOX Act, which requires an evaluation of internal control over financial reporting in association with our financial statements as of December 31, 2010. (See Item 9A, “Controls and Procedures” included in this Annual Report on Form 10-K.)
Competition
Our net income will depend, in large part, on our ability to acquire assets at favorable spreads over our borrowing costs. In acquiring our target assets, we will compete with other REITs, specialty finance companies, savings and loan associations, banks, mortgage bankers, insurance companies, mutual funds, institutional investors, investment banking firms, financial institutions, governmental bodies and other entities. Some of these entities may not be subject to the same regulatory constraints that we are (i.e., REIT compliance or maintaining an exemption under the 1940 Act). In addition, there are numerous REITs with similar asset acquisition objectives, including a number that have been recently formed, and others may be organized in the future. These other REITs will increase competition for the available supply of RMBS. Many of our competitors are significantly larger than us, have access to greater capital and other resources and may have other advantages over us. In addition, some of our competitors may have higher risk tolerances or different risk assessments, which could allow them to consider a wider variety of investments and establish more relationships than us. Current market conditions may attract more competitors, which may increase the competition for sources of financing. An increase in the competition for sources of funding could adversely affect the availability and cost of financing, and thereby adversely affect the market price of our common stock.
Employees
We are managed by PRCM Advisers pursuant to the management agreement between PRCM Advisers and us. All of our officers are partners or employees of PRCM Advisers or its affiliates. We have no direct employees.
Policies with Respect to Certain Other Activities
If our board of directors determines that additional funding is necessary or appropriate, we may raise such funds through additional offerings of equity or debt securities or the retention of cash flow (subject to provisions in the Code concerning distribution requirements and the taxability of undistributed REIT taxable income). In the event that our board of directors determines to raise additional equity capital, it has the authority, without stockholder approval, to issue additional common stock or preferred stock in any manner and on such terms and for such consideration as it deems appropriate, at any time.
As of the date of this filing, we do not intend to offer equity or debt securities in exchange for property. We have not in the past repurchased or otherwise reacquired our shares, but may do so in the future, subject to the requirements of the MGCL.
As of the date of this filing, we do not intend to invest in the securities of other REITs, other entities engaged in real estate activities or securities of other issuers for the purpose of exercising control over such entities.
We have not in the past made loans to third parties in the ordinary course of business for investment purposes, but may do so in the future. As of the date of this filing, we do not intend to underwrite the securities of other issuers.
We furnish our stockholders with annual reports containing consolidated financial statements audited by our independent registered public accountants and file quarterly reports with the SEC containing unaudited consolidated financial statements for each of the first three quarters of each fiscal year.
Our board of directors may change any of these policies without prior notice, or a vote of our stockholders, other than filing of annual and quarterly reports with the SEC which is required by law.
Financial Information
Financial information concerning our business for each of 2010 and 2009 is set forth in “Management's Discussion and Analysis of Financial Condition and Results of Operations,” “Qualitative and Quantitative Disclosures about Market Risk,” and the consolidated financial statements and the notes thereto, and the supplemental financial information, which are in Part II, Items 7, 7A and 8 of this Annual Report on Form 10-K.
Available Information
Our website can be found at www.twoharborsinvestment.com. We make available free of charge on, or through the SEC filings section of our website, access to our annual reports on Form 10-K, quarterly reports on Form 10-Q, current reports on Form 8-K, and any amendments to those reports, as are filed or furnished pursuant to Section 13(a) or 15(d) of the Securities Exchange Act of 1934, as amended, or the Exchange Act, as well as our proxy statements with respect to our annual meetings of stockholders, as soon as reasonably practicable after we electronically file such material with, or furnish it to, the SEC. Our Exchange Act reports filed with, or furnished to, the SEC are also available at the SEC's website at www.sec.gov. The content of any website referred to in this Form 10-K is not incorporated by reference into this Form 10-K unless expressly noted.
We also make available, free of charge, access to our charters for our Audit Committee, Compensation Committee, and Corporate Governance and Nominating Committee, as well as our Corporate Governance Guidelines, Code of Ethics Business Conduct and Ethics, Whistleblowing Procedures and Stockholder Communication Policy. Within the time period required by the SEC and the NYSE, we will post on our website any amendment to the Code of Ethics and any waiver applicable to any executive officer, director, or senior officer (as defined in the Code).
Our Investor Relations Department can be contacted at 590 Madison Avenue, Suite 3703, New York, NY 10021, Attn: Investor Relations, or by telephone at (212) 364-3221.
Forward-Looking Statements
This Annual Report on Form 10-K contains, or incorporates by reference, not only historical information, but also forward-looking statements within the meaning of the safe harbor provisions of the Private Securities Litigation Reform Act of 1995, as amended. Forward-looking statements involve numerous risks and uncertainties. Our actual results may differ from our beliefs, expectations, estimates, and projections and, consequently, you should not rely on these forward-looking statements as predictions of future events. Forward-looking statements are not historical in nature and can be identified by words such as “anticipate,” “estimate,” “will,” “should,” “expect,” “believe,” “intend,” “seek,” “plan” and similar expressions or their negative forms, or by references to strategy, plans, or intentions. These forward-looking statements are subject to risks and uncertainties, including, among other things, those described in this Annual Report on Form 10-K under the caption “Risk Factors.” Other risks, uncertainties, and factors that could cause actual results to differ materially from those projected are described below and may be described from time to time in reports we file with the Securities and Exchange Commission, or the SEC, including reports our Quarterly Reports on Form 10-Q and Current Reports on Form 8-K. Forward-looking statements speak only as of the date they are made, and we undertake no obligation to update or revise any such forward-looking statements, whether as a result of new information, future events, or otherwise.
Important factors, among others, that may affect our actual results include:
| |
• | changes in interest rates and the market value of our target assets; |
| |
• | changes in prepayment rates of mortgages underlying our target assets; |
| |
• | the timing of credit losses within our portfolio; |
| |
• | our exposure to adjustable-rate and negative amortization mortgage loans underlying our target assets; |
| |
• | the state of the credit markets and other general economic conditions, particularly as they affect the price of earning assets and the credit status of borrowers; |
| |
• | the concentration of the credit risks we are exposed to; |
| |
• | legislative and regulatory actions affecting the mortgage and derivative industries or our business; |
| |
• | the availability of target assets for purchase at attractive prices; |
| |
• | the availability of financing for our portfolio, including the availability of repurchase agreement financing; |
| |
• | declines in home prices; |
| |
• | increases in payment delinquencies and defaults on the mortgages underlying our Non-Agency securities; |
| |
• | changes in liquidity in the market for real estate securities, the re-pricing of credit risk in the capital markets, inaccurate ratings of securities by rating agencies, rating agency downgrades of securities, and increases in the supply of real estate securities available-for-sale; |
| |
• | changes in the values of securities we own and the impact of adjustments reflecting those changes on our income statement and balance sheet, including our stockholders' equity; |
| |
• | our ability to generate the amount of cash flow we expect from our investment portfolio; |
| |
• | changes in our investment, financing, and hedging strategies and the new risks that those changes may expose us to; |
| |
• | changes in the competitive landscape within our industry, including changes that may affect our ability to retain or attract personnel; |
| |
• | our ability to manage various operational risks associated with our business; |
| |
• | our ability to maintain appropriate internal controls over financial reporting; |
| |
• | our ability to establish, adjust and maintain appropriate hedges for the risks in our portfolio; |
| |
• | our ability to maintain our REIT qualification for U.S. federal income tax purposes; and |
| |
• | limitations imposed on our business due to our REIT status and our status as exempt from registration under the 1940 Act. |
This Annual Report on Form 10-K may contain statistics and other data that in some cases have been obtained or compiled from information made available by mortgage loan servicers and other third-party service providers.
Item 1A. Risk Factors
The following is a summary of the risk factors that we believe are most relevant to our business. These are factors which, individually or in the aggregate, we think could cause our actual results to differ significantly from anticipated or historical results. In addition to understanding the key risks described below, investors should understand that it is not possible to predict or identify all risk factors, and consequently, the following is not a complete discussion of all potential risks or uncertainties.
Risks Related to Our Business and Operations
The value of your investment is subject to the significant risks affecting REITs, and mortgage REITs in particular, described below. If any of the events described below occur, our business, financial condition, liquidity and/or results of operations could be adversely affected in a material way. This could cause the price of our common stock or warrants to decline, perhaps significantly, and you therefore may lose all or part of your investment.
Difficult conditions in the mortgage and residential real estate markets, the financial markets and the economy generally may cause the market value of our RMBS assets to decline, and these conditions may not improve in the near future.
Our results of operations are materially affected by conditions in the mortgage and residential real estate markets, the financial markets and the economy generally. Recently, concerns about the mortgage market and a declining real estate market, as well as inflation, energy costs, geopolitical issues and the availability and cost of credit, have contributed to increased volatility and diminished expectations for the economy and financial markets going forward. The mortgage market has been adversely affected by the tightening of lending standards and general availability of credit and there is no assurance that these conditions have stabilized or that they will not worsen. This has an impact on new demand for homes, which will compress the home ownership rates and weigh heavily on future home price performance. There is a strong correlation between home price growth rates (or losses) and mortgage loan delinquencies. The further deterioration of the mortgage market may cause us to experience losses related to our assets. Declines in the market values of our investments may adversely affect our results of operations and credit availability, which may reduce earnings and, in turn, cash available for distribution to stockholders.
Actions of the U.S. Government, Federal Reserve, U.S. Treasury and other governmental and regulatory bodies for the purpose of stabilizing the financial markets, or the market response to those actions, may not achieve the intended results; our business may not benefit from these actions and further government or market developments could adversely affect us.
In response to turmoil in the financial markets beginning in 2007, the U.S. Government, Federal Reserve, U.S. Treasury and other governmental and regulatory bodies have taken a number of actions designed to stabilize the financial markets, including the enactment of the Emergency Economic Stabilization Act of 2008 to, among other things, establish the Troubled Asset Relief Program to purchase certain assets from financial institutions; the enactment of the Housing and Economic Recovery Act of 2008, which established a new regulator for Fannie Mae and Freddie Mac; the establishment of the TALF, to provide non-recourse loans to borrowers to fund their purchase of certain eligible assets, such as certain asset-backed securities and commercial mortgage-backed securities; the establishment of the Public-Private Investment Program, which was designed to encourage the transfer of certain legacy assets, including real estate-related assets, off of the balance sheets of financial institutions; and the implementation of the Home Affordable Modification program, to facilitate the modification of delinquent mortgages and reduce foreclosures.
There can be no assurance that these actions will improve the efficiency and stability of U.S. financial markets, and the residential mortgage markets in particular, in the long term. To the extent the financial markets do not respond favorably to any of these actions or such actions do not function as intended, our business may be harmed. In addition, because the programs are designed, in part, to improve the markets for certain of our target assets, the establishment of these programs may result in increased competition for attractive opportunities in our target assets. The U.S. Government, the Federal Reserve, the U.S. Treasury and other governmental and regulatory bodies may take additional actions in the future to address the financial crisis. We cannot predict whether or when such actions may occur, and such actions could have an adverse impact on our business, results of operations and financial condition.
Our business model depends in part upon the continuing viability of Fannie Mae and Freddie Mac, or similar institutions, and any significant changes to their structure or creditworthiness could have an adverse impact on us.
We purchase Agency RMBS that are protected from the risk of default on the underlying mortgages by guarantees
from Fannie Mae, Freddie Mac or, in the case of the Ginnie Mae, the U.S. Government. Since 2007, Fannie Mae and Freddie Mac have reported substantial losses and a need for substantial amounts of additional capital. In 2008, in response to the deteriorating financial condition of Fannie Mae and Freddie Mac, the U.S. Government and U.S. Treasury undertook a series of actions designed to stabilize these government-sponsored entities, or GSEs, including placing them into a federal conservatorship, under which the Federal Housing Finance Agency, or FHFA, operate Fannie Mae and Freddie Mac.
In a further attempt to stabilize the financial and housing markets, in December 2009 the U.S. Government committed virtually unlimited capital to ensure the viability of Fannie Mae and Freddie Mac into 2012. There has been no assurance, however, that such capital will always be available, or that the agencies will always honor their guarantees and other obligations. If these GSEs fail to honor their guarantees, the value of any Agency RMBS assets that we hold would decline.
The U.S. Congress and the Obama Administration have announced their intention to reduce government support for housing finance, including the possible restructuring or elimination of these GSEs. In February 2011, a report released by the U.S. Department of Treasury and Department of Housing and Urban Development outlined three paths for GSE reform, all of which would drastically change the landscape of the U.S. mortgage market. The continued flow of residential mortgage-backed securities from these GSEs is essential to the operation of the mortgage markets in their current form, and crucial to our business model. In the wake of the financial crisis, Fannie Mae and Freddie Mac became the dominant, and in some cases, the only source of mortgage financing in the U.S. Although any reform would be expected to take several years to implement, if the structure of Fannie Mae or Freddie Mac were altered, or if they were eliminated altogether, the amount and type of Agency RMBS available for investment would be significantly affected. A reduction in supply of Agency RMBS would result in increased competition for those assets and likely lead to a significant increase in the price we would have to pay for our target assets.
It is not possible to predict the scope and nature of the actions that the U.S. Government will ultimately take with respect to the GSEs. As a result, market uncertainty with respect to the treatment of the GSEs, including that which may be created by proposed legislation or the eventual adoption of laws affecting the GSEs, could have the effect of reducing the actual or perceived quality of, and therefore the market value for, the Agency RMBS that we currently hold in our portfolio.
All of the foregoing could materially adversely affect the availability, pricing, liquidity, market value and financing of our target assets and materially adversely affect our business, operations and financial condition.
The recent adoption of the Dodd-Frank Act and future regulations implementing such legislation affect the mortgage industry and the MBS markets, which may in turn have an adverse impact on our business, results of operations and financial conditions.
On July 21, 2010, the President signed into law major financial services reform legislation in the form of the Dodd-Frank Wall Street Reform and Consumer Protection Act, or the Dodd-Frank Act. The Dodd-Frank Act significantly changes the regulation of financial institutions and the financial services industry, including the mortgage industry. The Dodd-Frank Act tasks many agencies with issuing a variety of new regulations, including rules related to mortgage origination and servicing, securitization and derivatives. As the Dodd-Frank Act has only recently been enacted and because a significant number of regulations thereunder have yet to be proposed or adopted, it is unclear how this legislation may affect the borrowing environment, the investing environment for Agency MBS, or interest rate swaps and other derivatives. Consequently, it is not possible for us to predict how the Dodd-Frank Act will affect our business, and there can be no assurance that the Dodd-Frank Act will not have an adverse impact on our results of operations and financial condition.
We operate in a highly competitive market and competition may limit our ability to acquire desirable assets.
We operate in a highly competitive market. Our profitability depends, in large part, on our ability to acquire target assets at favorable prices. In acquiring assets, we compete with a variety of institutional investors, including other REITs, specialty finance companies, public and private funds, commercial and investment banks, commercial finance and insurance companies, governmental entities and other financial institutions. Many of our competitors are substantially larger and have greater financial, technical, marketing and other resources than we do. Furthermore, competition for assets may lead to the price of such assets increasing and their availability decreasing, which may limit our ability to generate desired returns.
We may change any of our strategies, policies or procedures without stockholder consent.
We may change any of our strategies, policies or procedures with respect to investments, asset allocation, growth, operations, indebtedness, financing strategy and distributions at any time without the consent of stockholders, which could result in our making investments that are different from, and possibly riskier than, the types of investments described in this Annual Report on Form 10-K. A change in strategy may increase our exposure to credit risk, interest rate risk,
financing risk, default risk and real estate market fluctuations. These changes could adversely affect our financial condition, risk profile, results of operations, the market price of our common stock or warrants and our ability to make distributions to stockholders.
The lack of liquidity of our assets may adversely affect our business, including our ability to value and sell our assets.
We may acquire assets or other instruments that are not liquid, including securities and other instruments that are not publicly traded, and market conditions could significantly and negatively affect the liquidity of other assets. It may be difficult or impossible to obtain third-party pricing on the assets that we purchase. Illiquid assets typically experience greater price volatility, as a ready market may not exist for such assets, and such assets can be more difficult to value. In addition, validating third-party pricing for illiquid assets may be more subjective than more liquid assets. Any illiquidity of our assets may make it difficult for us to sell such assets if the need or desire arises. In addition, if we are required to liquidate all or a portion of our portfolio quickly, we may realize significantly less than the value at which we previously recorded our assets. Assets that are illiquid are more difficult to finance, and to the extent that we use leverage to finance assets that become illiquid we may lose that leverage or have it reduced. Assets tend to become less liquid during times of financial stress, which is often the time that liquidity is most needed. As a result, our ability to sell assets or vary our portfolio in response to changes in economic and other conditions may be limited by liquidity constraints, which could adversely affect our results of operations and financial condition.
Maintenance of our 1940 Act exemption imposes limits on our operations.
We intend to conduct our operations so as not to become required to register as an investment company under the 1940 Act. Section 3(a)(1)(A) of the 1940 Act defines an investment company as any issuer that is or holds itself out as being engaged primarily in the business of investing, reinvesting or trading in securities. Section 3(a)(1)(C) of the 1940 Act defines an investment company as any issuer that is engaged or proposes to engage in the business of investing, reinvesting, owning, holding or trading in securities and owns or proposes to acquire investment securities having a value exceeding 40% of the value of the issuer's total assets (exclusive of U.S. Government securities and cash items) on an unconsolidated basis. Excluded from the term “investment securities,” among other things, are U.S. Government securities and securities issued by majority-owned subsidiaries that are not themselves investment companies and are not relying on the exception from the definition of investment company set forth in Section 3(c)(1) or Section 3(c)(7) of the 1940 Act.
We are organized as a holding company that conducts its businesses primarily through Subsidiary LLC. Both Two Harbors and Subsidiary LLC intend to conduct their operations so that they do not come within the definition of an investment company because less than 40% of the value of their total assets on an unconsolidated basis will consist of “investment securities.”
Certain of Subsidiary LLC's subsidiaries intend to rely upon the exemption from registration as an investment company under the 1940 Act pursuant to Section 3(c)(5)(C) of the 1940 Act, which is available for entities “primarily engaged in the business of purchasing or otherwise acquiring mortgages and other liens on and interests in real estate.” This exemption generally means that at least 55% of each such subsidiary's portfolio must be comprised of qualifying assets and at least 80% of its portfolio must be comprised of qualifying assets and real estate-related assets under the 1940 Act. Qualifying assets for this purpose include mortgage loans and other assets, such as whole pool Agency and non-Agency RMBS, which are considered the functional equivalent of mortgage loans for the purposes of the 1940 Act. We expect each of our subsidiaries relying on Section 3(c)(5)(C) to invest at least 55% of its assets in whole pool Agency and non-Agency RMBS and other interests in real estate that constitute qualifying assets in accordance with SEC staff guidance and an additional 25% of its assets in either qualifying assets and other types of real estate related assets that do not constitute qualifying assets.
As a result of the foregoing restrictions, we are limited in our ability to make or dispose of certain investments. To the extent that the SEC staff publishes new or different guidance with respect to these matters, we may be required to adjust our strategy accordingly. In addition, we may be limited in our ability to make certain investments and these limitations could result in the subsidiary holding assets that we might wish to sell or selling assets that we might wish to hold. Although we monitor the portfolios of our subsidiaries relying on the Section 3(c)(5)(C) exemption periodically and prior to each acquisition or disposition of assets, there can be no assurance that such subsidiaries will be able to maintain this exemption.
We will make the determination of whether an entity is a majority-owned subsidiary. The 1940 Act defines a majority-owned subsidiary of a person as a company 50% or more of the outstanding voting securities of which are owned by such person, or by another company which is a majority-owned subsidiary of such person. The 1940 Act further defines voting securities as any security presently entitling the owner or holder thereof to vote for the election of directors of a company. We treat companies in which we own at least a majority of the outstanding voting securities as majority-owned subsidiaries for purposes of the 40% test. We have not requested the SEC staff to approve our treatment of any company as a majority-owned subsidiary and the SEC staff has not done so. If the SEC or its staff were to disagree with our
treatment of one or more companies as majority-owned subsidiaries, we would need to adjust our strategy and our assets in order to continue to pass the 40% test. Any such adjustment in our strategy could have a material adverse effect.
Qualification for exemption from registration under the 1940 Act limits our ability to make certain investments. For example, these restrictions limit the ability of our subsidiaries to invest directly in mortgage-backed securities that represent less than the entire ownership in a pool of mortgage loans, debt and equity tranches of securitizations and certain asset backed securities and real estate companies or in assets not related to real estate.
Loss of our 1940 Act exemption would adversely affect us, the market price of shares of our common stock or warrants and our ability to distribute dividends, and could result in the termination of the management agreement with PRCM Advisers.
As described above, we intend to conduct operations so as not to become required to register as an investment company under the 1940 Act based on current laws, regulations and guidance. Although we monitor our portfolio periodically, there can be no assurance that we will be able to maintain our exemption as an investment company under the 1940 Act. If we were to fail to qualify for an exemption, we could be required to restructure our activities or the activities of our subsidiaries, including effecting sales of assets in a manner that, or at a time when, we would not otherwise choose, which could negatively affect the value of our common stock or warrants, the sustainability of our business model, and our ability to make distributions. Such sales could occur during adverse market conditions, and we could be forced to accept prices below that which we believe are appropriate. The loss of our 1940 Act exclusion would also permit PRCM Advisers to terminate the management agreement, which could result in a material adverse effect on our business and results of operations.
Rapid changes in the values of our assets may make it more difficult for us to maintain our qualification as a REIT or our exemption from the 1940 Act.
If the market value or income potential of our assets declines as a result of increased interest rates, prepayment rates, general market conditions, government actions or other factors, we may need to increase our real estate assets and income or liquidate our non-qualifying assets to maintain our REIT qualification or our exemption from the 1940 Act. If the decline in real estate asset values or income occurs quickly, this may be especially difficult to accomplish. This difficulty may be exacerbated by the illiquid nature of any non-real estate assets we may own. We may have to make decisions that we otherwise would not make absent the REIT and 1940 Act considerations
We use leverage in executing our business strategy, which may adversely affect the return on our assets and may reduce cash available for distribution to our stockholders, as well as increase losses when economic conditions are unfavorable.
We use leverage to finance our investment operations and to enhance our financial returns. Our primary source of leverage is short-term repurchase agreement financing for our Agency and Non-Agency RMBS assets. Other sources of leverage may include credit facilities (including term loans and revolving facilities).
Through the use of leverage, we may acquire positions with market exposure significantly greater than the amount of capital committed to the transaction. For example, by entering into repurchase agreements with advance rates, or haircut levels, of 5% (which is not an atypical haircut for Agency RMBS), we could leverage capital allocated to Agency RMBS by a ratio of as much as 20 to 1. It is not uncommon for investors in Agency RMBS to obtain leverage equal to ten or more times equity through the use of repurchase agreement financing. We anticipate that we may deploy, on a debt-to-equity basis, up to ten times leverage on our Agency RMBS assets and up to two times on our non-Agency RMBS assets. However, there is no specific limit on the amount of leverage that we may use.
Leverage will magnify both the gains and the losses of our positions. Leverage will increase our returns as long as we earn a greater return on investments purchased with borrowed funds than our cost of borrowing such funds. However, if we use leverage to acquire an asset and the value of the asset decreases, the leverage will increase our losses. Even if the asset increases in value, if the asset fails to earn a return that equals or exceeds our cost of borrowing, the leverage will decrease our returns.
We may be required to post large amounts of cash as collateral or margin to secure our leveraged positions. In the event of a sudden, precipitous drop in value of our financed assets, we might not be able to liquidate assets quickly enough to repay our borrowings, further magnifying losses. Even a small decrease in the value of a leveraged asset may require us to post additional margin or cash collateral. This may decrease the cash available to us for distributions to stockholders.
We depend on repurchase agreements and other credit facilities to execute our business plan and our inability to access funding through these sources could have a material adverse effect on our results of operations, financial condition and business.
Our ability to purchase and hold assets is affected by our ability to secure repurchase agreements and other credit facilities on acceptable terms. We currently have master repurchase agreements in place with several counterparties,
including a 364-day repurchase facility with an aggregate maximum borrowing capacity of $75.0 million. We expect to execute additional master repurchase agreements, but we can provide no assurance that lenders will be willing or able to provide us with sufficient financing through the repurchase markets or otherwise. In addition, because repurchase agreements are short-term commitments of capital, changes in conditions in the repurchase markets may make it more difficult for us to secure continued financing. During certain periods of a credit cycle, lenders may lose their ability or curtail their willingness to provide financing. If we are not able to arrange for replacement financing on acceptable terms, or if we default on our covenants or are otherwise unable to access funds under any of our master repurchase agreements, we may have to curtail our asset acquisition activities and/or dispose of assets.
It is possible that the lenders that provide us with financing could experience changes in their ability to advance funds to us, independent of our performance or the value of our assets. If major market participants exit the business, it could further adversely affect the marketability of RMBS and other financial assets in which we invest, and this could negatively affect the value of our assets, thus reducing our net book value. Furthermore, if many of our lenders are unwilling or unable to provide us with financing, we could be forced to sell assets when prices are depressed. In addition, if the regulatory capital requirements imposed on our lenders change, they may be required to significantly increase the cost of the financing that they provide to us. Our lenders also may revise their eligibility requirements for the types of assets they are willing to finance or the terms of such financings, based on, among other factors, the regulatory environment and their management of perceived risk. Moreover, the amount of financing we receive under our repurchase agreements will be directly related to the lenders' valuation of the assets that secure the outstanding borrowings. Typically, repurchase agreements grant the respective lender the right to reevaluate the market value of the assets that secure outstanding borrowings at any time. If a lender determines that the value of the assets has decreased, it has the right to initiate a margin call. A margin call would require us to transfer additional assets to such lender or to repay a portion of the outstanding borrowings. Any such margin call could have a material adverse effect on our results of operations, financial condition, business, liquidity and ability to make distributions to stockholders, and could cause the value of our common stock or warrants to decline. We may be forced to sell assets at significantly depressed prices to meet margin calls and to maintain adequate liquidity, which could cause us to incur losses. Moreover, to the extent that we are forced to sell assets because of changes in market conditions, other market participants may face similar pressures, which could exacerbate a difficult market environment and which could result in significantly greater losses on our sale of such assets. In an extreme case of market duress, a market may not exist for certain of our assets at any price.
Our inability to meet certain financial covenants under the guaranty agreement related to the Wells Fargo repurchase facility could adversely affect our financial condition, results of operations and cash flows.
In connection with the repurchase facility between our subsidiary, Two Harbors Asset I, and Wells Fargo National Bank, we entered into a guaranty agreement in favor of Wells Fargo to guarantee the obligations of Two Harbors Asset I under the repurchase facility. As described more fully in the guaranty agreement, we are required to maintain certain financial covenants during the term of the repurchase agreement, including that, on any date, (i) the ratio of the our Total Indebtedness to our Tangible Net Worth, on a consolidated basis, shall not be greater than 6.00 to 1.00; (ii) our Liquidity, on a consolidated basis, shall not be less than $15,000,000; and (c) our Tangible Net Worth, on a consolidated basis, shall not be less than $150,000,000 (capitalized terms have the meanings given them in the guaranty agreement). Compliance with these new financial covenants will depend on market factors and the strength of our business and operating results. Various risks, uncertainties and events beyond our control could affect our ability to comply with the financial covenants. Failure to comply with our financial covenants could result in an event of default, termination of the repurchase facility, acceleration of all amounts owing under the repurchase facility, and give Wells Fargo the right to exercise certain other remedies under the repurchase agreement, including the sale of the RMBS subject to repurchase at the time of default, unless we were able to negotiate a waiver. Wells Fargo could condition any such waiver on an amendment to the repurchase facility and guaranty agreement on terms that may be unfavorable to Two Harbors Asset I and to us. If we are unable to negotiate a covenant waiver or replace or refinance our RMBS under a new repurchase facility on favorable terms or at all, our financial condition, results of operations and cash flows could be adversely affected.
If a counterparty to a repurchase agreement defaults on its obligation to resell the underlying security back to us at the end of the purchase agreement term, or if the value of the underlying security has declined as of the end of that term, or if we default on our obligations under the repurchase agreement, we will incur losses on the repurchase agreement.
When we enter into repurchase agreements, we sell securities to lenders (i.e., repurchase agreement counterparties) and receive cash from the lenders. The lenders are obligated to resell the same securities back to us at the end of the term of the repurchase agreement. Because the cash that we receive from the lender when we initially sell the securities to the lender is less than the value of those securities (the difference being the “haircut”), if the lender defaults on its obligation to resell the same securities back to us, we would incur a loss on the repurchase agreement equal to the amount of the haircut (assuming there was no change in the value of the securities). We would also incur losses on a repurchase agreement if the value of the underlying securities has declined as of the end of the repurchase agreement term, because we would have to repurchase the securities for their initial value but would receive securities worth less than that amount.
Further, if we default on our obligations under a repurchase agreement, the lender will be able to terminate the repurchase agreement and cease entering into any other repurchase agreements with us. Typically, our repurchase agreements contain cross-default provisions, so that if a default occurs under any repurchase agreement, the lender can also declare a default with respect to all other repurchase agreements with us. If a default occurs under any of our repurchase agreements and a lender terminates one or more of its repurchase agreements, we may need to enter into replacement repurchase agreements with different lenders. There can be no assurance that we will be successful in entering into such replacement repurchase agreements on the same terms as the repurchase agreements that were terminated or at all. Any losses that we incur on our repurchase agreements could adversely affect our earnings and thus our cash available for distribution to stockholders.
An increase in our borrowing costs relative to the interest that we receive on our leveraged assets may adversely affect our profitability and our cash available for distribution to stockholders.
As our repurchase agreements and other short-term borrowings mature, we must enter into new borrowings, find other sources of liquidity or sell assets. An increase in short-term interest rates at the time that we seek to enter into new borrowings would reduce the spread between the returns on our assets and the cost of our borrowings. This would adversely affect the returns on our assets, which might reduce earnings and, in turn, cash available for distribution to stockholders.
We are highly dependent on information systems and systems failures could significantly disrupt our business, which may, in turn, negatively affect the market price of our common stock or warrants and our ability to pay dividends.
Our business is highly dependent on communications and information systems of PRCM Advisers and Pine River. Any failure or interruption of the systems of PRCM Advisers or Pine River could cause delays or other problems in our trading activities, which could have a material adverse effect on our financial results and negatively affect the market price of our common stock or warrants and our ability to pay dividends to stockholders.
We enter into hedging transactions that expose us to contingent liabilities in the future, which may adversely affect our financial results or cash available for distribution to stockholders.
We engage in hedging transactions intended to hedge various risks to our portfolio, including the exposure to adverse changes in interest rates. Our hedging activity varies in scope based on, among other things, the level and volatility of interest rates, the type of assets held and other changing market conditions. Although these transactions are intended to reduce our exposure to various risks, hedging may fail to protect or could adversely affect us because, among other things:
| |
• | hedging can be expensive, particularly during periods of volatile or rapidly changing interest rates; |
| |
• | available hedges may not correspond directly with the risks for which protection is sought; |
| |
• | the duration of the hedge may not match the duration of the related liability; |
| |
• | the amount of income that a REIT may earn from certain hedging transactions (other than through taxable REIT subsidiaries, or TRS's) is limited by U.S. federal income tax provisions governing REITs; |
| |
• | the credit quality of a hedging counterparty may be downgraded to such an extent that it impairs our ability to sell or assign our side of the hedging transaction; and |
| |
• | the hedging counterparty may default on its obligation to pay. |
Subject to maintaining our qualification as a REIT, there are no current limitations on the hedging transactions that we may undertake. Our hedging transactions could require us to fund large cash payments in certain circumstances (e.g., the early termination of the hedging instrument caused by an event of default or other early termination event, or a demand by a counterparty that we make increased margin payments). Our ability to fund these obligations will depend on the liquidity of our assets and access to capital at the time. The need to fund these obligations could adversely affect our financial condition. Further, hedging transactions, which are intended to limit losses, may actually result in losses, which would adversely affect our earnings and could in turn reduce cash available for distribution to stockholders.
Hedging instruments involve risk because they may not be traded on regulated exchanges, guaranteed by an exchange or its clearinghouse, or regulated by any U.S. or foreign governmental authorities. Consequently, there may be no requirements with respect to record keeping, financial responsibility or segregation of customer funds and positions. The Commodity Futures Trading Commission is in the process of proposing rules under the Dodd-Frank Act which may make our hedging more difficult or increase our costs. Furthermore, the enforceability of agreements underlying hedging transactions may depend on compliance with applicable statutory and commodity and other regulatory requirements and, depending on the identity of the counterparty, applicable international requirements. The business failure of a hedging counterparty will most likely result in its default. Default by a hedging counterparty may result in the loss of unrealized profits and force us to cover our commitments, if any, at the then current market price. Although generally we seek to reserve the right to terminate our hedging positions, it may not always be possible to dispose of or close out a hedging position without the consent of the hedging counterparty and we may not be able to enter into an offsetting contract in order to cover our risk. We cannot assure you that a liquid secondary market will exist for hedging instruments purchased
or sold, and we may be required to maintain a position until exercise or expiration, which could result in losses.
Our results may experience greater fluctuations by not electing hedge accounting treatment on the derivatives that we enter into.
We have elected to not qualify for hedge accounting treatment under ASC 815, Derivatives and Hedging, for our current derivative instruments. The economics of our derivative hedging transactions are not affected by this election; however, our GAAP earnings may be subject to greater fluctuations from period to period as a result of this accounting treatment for changes in fair value of certain interest rate swap agreements or for the accounting of the underlying hedged assets or liabilities in our financial statements, if it does not necessarily match the accounting used for interest rate swap agreements.
We have limited experience in making critical accounting estimates, and our financial statements may be materially affected if our estimates prove to be inaccurate.
Financial statements prepared in accordance with GAAP require the use of estimates, judgments and assumptions that affect the reported amounts. Different estimates, judgments and assumptions reasonably could be used that would have a material effect on the financial statements, and changes in these estimates, judgments and assumptions are likely to occur from time to time. Significant areas of accounting requiring the application of management's judgment include assessing securities for other-than-temporary impairment and determining the fair value of investment securities. These estimates, judgments and assumptions are inherently uncertain, and, if they prove to be wrong, then we face the risk that charges to income will be required. In addition, because we have limited operating history in some of these areas and limited experience in making these estimates, judgments and assumptions, the risk of future charges to income may be greater than if we had more experience in these areas. Any such charges could significantly harm our business, financial condition, results of operations and the price of our securities. See “Management's Discussion and Analysis of Financial Condition and Results of Operations - Critical Accounting Policies” for a discussion of the accounting estimates, judgments and assumptions that we believe are the most critical to an understanding of our business, financial condition and results of operations.
Declines in the market values of our assets may adversely affect our periodic reported results and credit availability, which may reduce earnings and, in turn, cash available for distribution to stockholders.
A substantial portion of our assets are classified for accounting purposes as “available-for-sale.” Changes in the market values of those assets will be directly charged or credited to stockholders' equity. As a result, a decline in values may reduce our book value. Moreover, if the decline in value of an available-for-sale security is other than temporary, such decline will reduce earnings.
A decline in the market value of our assets may adversely affect us, particularly in instances where we have borrowed money based on the market value of those assets. If the market value of those assets declines, the lender may require us to post additional collateral to support the loan. If we are unable to post the additional collateral, we would have to sell the assets at a time when we might not otherwise choose to do so. A reduction in credit available may reduce our earnings and, in turn, cash available for distribution to stockholders.
We depend on third-party service providers, including mortgage servicers, for a variety of services related to our RMBS. We are, therefore, subject to the risks associated with third-party service providers.
We depend on a variety of services provided by third-party service providers related to our RMBS. We rely on the mortgage servicers who service the mortgage loans backing our RMBS to, among other things, collect principal and interest payments on the underlying mortgages and perform loss mitigation services. Mortgage servicers and other service providers to our RMBS, such as trustees, bond insurance providers and custodians, may not perform in a manner that promotes our interests.
For example, recent legislation intended to reduce or prevent foreclosures through, among other things, loan modifications may reduce the value of mortgage loans underlying our RMBS. Mortgage servicers may be incentivized by the Federal government to pursue such loan modifications, as well as forbearance plans and other actions intended to prevent foreclosure, even if such loan modifications and other actions are not in the best interests of the beneficial owners of the mortgage loans. Similarly, legislation delaying the initiation or completion of foreclosure proceedings on specified types of residential mortgage loans or otherwise limiting the ability of mortgage servicers to take actions that may be essential to preserve the value of the mortgage loans may also reduce the value of mortgage loans underlying our RMBS. Any such limitations are likely to cause delayed or reduced collections from mortgagors and generally increase servicing costs. As a consequence of the foregoing matters, our business, financial condition and results of operations may be adversely affected.
Risks Related to our Management and Relationship with PRCM Advisers and Pine River
We are dependent on PRCM Advisers and Pine River and may not find a suitable replacement if we or PRCM Advisers terminates the management agreement.
We have no employees and no separate facilities. Instead, we are completely reliant for these resources on PRCM Advisers, which has significant discretion as to the implementation and execution of our business strategies and risk management practices. PRCM Advisers may not have sufficient access to Pine River's employees, systems and facilities in order to comply with its obligations under the management agreement. We are also subject to the risk that PRCM Advisers will terminate the management agreement and that no suitable replacement will be found.
PRCM Advisers is only contractually committed to serve Two Harbors until October 28, 2012. Thereafter, the management agreement is renewable on an annual basis; provided, however, that PRCM Advisers may terminate the management agreement annually upon 180 days' prior notice. If the management agreement is terminated and no suitable replacement is found to manage Two Harbors, we may not be able to execute our business plan.
We will have no recourse to Pine River if it does not fulfill its obligations under the shared facilities and services agreement.
Neither we nor PRCM Advisers has any employees or separate facilities. As a result, PRCM Advisers has entered into a shared facilities and services agreement with Pine River pursuant to which PRCM Advisers will be provided with the personnel, services and resources necessary for PRCM Advisers to perform its obligations and responsibilities under the management agreement in exchange for certain amounts payable by PRCM Advisers. Because we are not a party to the shared facilities and services agreement, we will not have any recourse to Pine River if it does not fulfill its obligations under the shared facilities and services agreement, or if Pine River and PRCM Advisers choose to amend or terminate the shared facilities and services agreement.
There are conflicts of interest in our relationship with Pine River and its affiliates, including PRCM Advisers, which could result in decisions that are not in the best interests of our stockholders.
We are subject to conflicts of interest arising out of our relationship with Pine River and its affiliates, including PRCM Advisers. PRCM Advisers is wholly-owned by Pine River. Each of Brian Taylor (the Chairman of Two Harbors' Board of Directors), Thomas Siering (a Director, and the Chief Executive Officer and President of Two Harbors), Steven Kuhn (the Co-Chief Investment Officer of Two Harbors), Jeff Stolt (the Chief Financial Officer of Two Harbors), and Timothy O'Brien (the General Counsel and Secretary of Two Harbors) is a partner and owner of equity interests in Pine River. All of our other executive officers are employees or partners of Pine River. In addition, Mark Ein (the non-executive Vice Chairman of Two Harbors' Board of Directors) owns an interest in CLA Founders LLC, which, in consideration for services to be provided to PRCM Advisers under a sub-management agreement, is entitled to receive a percentage of the management fee earned by PRCM Advisers, and an affiliate of his is an investor in a private fund for which Pine River serves as investment manager. As a result, the management agreement with PRCM Advisers was negotiated between related parties, and its terms, including fees payable to PRCM Advisers, may not be as favorable to us as if they had been negotiated with an unaffiliated third party. In addition, we may choose not to enforce, or to enforce less vigorously, our rights under the management agreement because of our desire to maintain our ongoing relationship with PRCM Advisers.
The management agreement with PRCM Advisers does not prevent PRCM Advisers and its affiliates from engaging in additional management or investment opportunities. Pine River and its affiliates, including PRCM Advisers, engage in additional management or investment opportunities that have overlapping objectives with us, and thus face conflicts in the allocation of resources between us, any other funds they manage and for their own accounts. Additionally, the ability of PRCM Advisers and Pine River and their respective officers and employees to engage in other business activities reduces the time PRCM Advisers spends managing Two Harbors. Our executive officers and the employees of PRCM Advisers and Pine River do not spend all of their time managing Two Harbors. Our executive officers and the employees of PRCM Advisers and Pine River allocate some, or a material portion, of their time to other businesses and activities. None of these individuals is required to devote a specific amount of time to Two Harbors' affairs. Accordingly, we compete with Pine River, its existing funds, investment vehicles, other ventures and possibly other entities in the future for the time and attention of these officers.
We may enter into additional transactions with Pine River or its affiliates. In particular, we may purchase assets from Pine River or its affiliates or make co-purchases alongside Pine River or its affiliates. These transactions may not be the result of arm's length negotiations and may involve conflicts between our interests and the interests of Pine River and/or its affiliates. There can be no assurance that any procedural protections will be sufficient to assure that these transactions will be made on terms that will be at least as favorable to us as those that would have been obtained in an arm's length transaction.
We will compete with current and future investment entities affiliated with Pine River for access to the benefits that our relationship with Pine River provides to Two Harbors, including access to investment opportunities.
There are conflicts of interest in allocating investment opportunities among Two Harbors and other funds, investment vehicles and ventures managed by Pine River. There is a significant overlap in the assets and investment strategies of Two Harbors and Pine River's private funds, and many of the same trading and investment personnel provide services to both entities. Further, Pine River and its affiliates may in the future form additional funds or sponsor additional investment
vehicles and ventures that have overlapping objectives with Two Harbors and therefore may compete with us for investment opportunities and Pine River resources. It is the written policy of Pine River and PRCM Advisers to allocate investment opportunities on a fair and equitable basis among all entities for which they provide investment management services. However, we cannot assure you that Pine River and PRCM Advisers will always allocate every investment opportunity in a manner that is advantageous for us; indeed, we may expect that the fair and equitable allocation of investment opportunities will at times result in our receiving only a portion of, or none of, certain investment opportunities.
The loss of our access to Pine River's investment professionals and principals may adversely affect our ability to achieve our investment objectives.
We depend on PRCM Advisers' access, through a shared facilities and services agreement, to the investment professionals and principals of Pine River and the information and origination opportunities generated by Pine River's investment professionals and principals during the normal course of their investment and portfolio management activities. These investment professionals and principals evaluate, negotiate, structure, close and monitor our investments and our financing activities and we depend on their continued service. The departure of a significant number of the investment professionals or principals of Pine River could have a material adverse effect on our ability to achieve our investment objectives. In addition, we cannot assure you that PRCM Advisers will remain Two Harbors' manager or that we will continue to have access to Pine River's investment professionals or principals or its information and asset origination opportunities.
PRCM Advisers, Pine River and our executive officers have limited experience managing a public company and as a result we may be unable to manage our public reporting requirements.
Neither PRCM Advisers nor Pine River has previously managed the affairs of a publicly-listed company. Although certain of our directors and officers have public company experience, others do not, and they have not previously served together in the management of any public company. Management of a public company requires particular skills in areas such as governance, accounting, financial reporting, investor relations, systems, controls and regulatory compliance. Our relative inexperience in these areas increases the risk to Two Harbors that management will fail to comply with one or more requirements related to Two Harbors' public company status. Such failure could have materially adverse impacts on the price and liquidity of Two Harbors' securities.
PRCM Advisers has limited experience in managing a REIT, which may hinder its ability to achieve our investment objectives or result in loss of our qualification as a REIT.
The REIT rules and regulations are highly technical and complex, and the failure to comply with these rules and regulations could prevent us from qualifying as a REIT or could force us to pay unexpected taxes and penalties. PRCM Advisers has limited experience in managing a portfolio of assets under these complex rules and regulations. Before the closing of the merger transaction PRCM Advisers' and Pine River's officers and employees had no prior experience operating a REIT and operating a business in compliance with the numerous technical restrictions and limitations set forth in the Code or the 1940 Act applicable to REITs. The limited experience may hinder our ability to achieve our investment objectives or may result in loss of our qualification as a REIT.
Our board of directors has approved very broad investment guidelines for Two Harbors and will not review or approve each investment decision made by PRCM Advisers.
Our board of directors periodically reviews our investment guidelines and our investment portfolio but does not review or approve specific investments. PRCM Advisers has great latitude within the broad parameters of our investment guidelines in determining our investments and investment strategies, which could result in investment returns that are substantially below expectations or that result in material losses.
The manner of determining the management fee may not provide sufficient incentive to PRCM Advisers to maximize risk-adjusted returns on our investment portfolio because it is based on our stockholders' equity and not on our financial performance.
PRCM Advisers is entitled to receive a management fee that is based on our stockholders' equity at the end of each quarter, regardless of our financial performance. Accordingly, significant management fees will be payable to PRCM Advisers even if we have a net loss during a quarter. PRCM Advisers' right to such compensation may not provide sufficient incentive to PRCM Advisers to devote its time and effort to maximize risk-adjusted returns on our investment portfolio, which could, in turn, adversely affect our financial results. Further, the management fee structure gives PRCM Advisers the incentive to maximize stockholders' equity by the issuance of new common stock or the retention of existing equity, regardless of the effect of these actions on existing stockholders. In other words, the management fee structure rewards PRCM Advisers primarily based on the size of Two Harbors, and not on our returns to stockholders.
The termination of the management agreement may be difficult and costly, which may adversely affect our inclination to end our relationship with PRCM Advisers.
Termination of the management agreement with PRCM Advisers without cause is difficult and costly. The term
“cause” is limited to certain specifically described circumstances. The management agreement provides that, in the absence of cause, we may only terminate it after October 28, 2012, upon the vote of at least two-thirds of all of our independent directors or by a vote of the holders of a majority of the outstanding shares of our common stock. Additionally, upon a termination by Two Harbors without cause (or upon a termination by PRCM Advisers due to our material breach), the management agreement requires us to pay PRCM Advisers a termination payment equal to three times the sum of the annual management fee received by PRCM Advisers during the 24-month period before such termination, calculated as of the end of the most recently completed fiscal quarter. This provision increases the effective cost to us of terminating our relationship with PRCM Advisers, even if we believe that PRCM Advisers' performance is not satisfactory.
PRCM Advisers' and Pine River's liability is limited under the management agreement, and we have agreed to indemnify PRCM Advisers and its affiliates and advisers, including Pine River, against certain liabilities. As a result, we could experience poor performance or losses for which PRCM Advisers and Pine River would not be liable.
Pursuant to the management agreement, PRCM Advisers does not assume any responsibility other than to render the services called for thereunder and will not be responsible for any action of our board of directors in following or declining to follow its advice or recommendations. PRCM Advisers and its officers, stockholders, members, managers, personnel and directors, any person controlling or controlled by PRCM Advisers and any person providing sub-advisory services to PRCM Advisers will not be liable to Two Harbors, any of our subsidiaries, any of our directors, stockholders or partners or any subsidiary's stockholders, members or partners for acts or omissions performed in accordance with or pursuant to the management agreement, except by reason of acts constituting reckless disregard of PRCM Advisers' duties under the management agreement which has a material adverse effect on Two Harbors, willful misconduct or gross negligence, as determined by a final non-appealable order of a court of competent jurisdiction. We have agreed to indemnify PRCM Advisers and its affiliates and sub-advisers, including Pine River, with respect to all expenses, losses, damages, liabilities, demands, charges and claims arising from acts or omissions of such indemnified parties not constituting reckless disregard of PRCM Advisers' duties under the management agreement which has a material adverse effect on Two Harbors, willful misconduct or gross negligence. As a result, if we experience poor performance or losses, PRCM Advisers would not be liable.
Risks Related To Our Assets
We may not realize gains or income from our assets.
We seek to generate current income and capital appreciation for our stockholders. However, the assets that we acquire may not appreciate in value and, in fact, may decline in value, and the securities that we acquire may experience defaults of interest and/or principal payments. Accordingly, we may not be able to realize gains or income from our assets. Any gains that we do realize may not be sufficient to offset other losses that we experience. Any income that we realize may not be sufficient to offset our expenses.
Changes in mortgage prepayment rates may adversely affect the value of our assets.
The value of our RMBS assets is affected by prepayment rates on the mortgage loans underlying the RMBS, and our investment strategy includes making investments based on our expectations regarding prepayment rates. Typically, the value of a mortgage-backed security includes market assumptions regarding the speed at which the underlying mortgages will be prepaid. Faster than expected prepayments could adversely affect our profitability, including in the following ways:
| |
• | We may purchase RMBS that have a higher interest rate than the market interest rate at the time. In exchange for this higher interest rate, we may pay a premium over the par value to acquire the security. In accordance with GAAP, we may amortize this premium over the estimated term of the RMBS. If the RMBS is prepaid in whole or in part prior to its maturity date, however, we may be required to expense the premium that was prepaid at the time of the prepayment. |
| |
• | A substantial portion of our adjustable-rate RMBS may bear interest rates that are lower than their fully indexed rates, which are equivalent to the applicable index rate plus a margin. If an adjustable-rate RMBS is prepaid prior to or soon after the time of adjustment to a fully-indexed rate, we will have held that RMBS while it was least profitable and lost the opportunity to receive interest at the fully indexed rate over the remainder of its expected life. |
| |
• | If we are unable to acquire new RMBS similar to the prepaid RMBS, our financial condition, results of operations and cash flows would suffer. |
Prepayment rates that are faster than anticipated may increase or decrease the value of a security, depending on the type of security and the price paid to acquire the security. Prepayment rates may be affected by a number of factors including the availability of mortgage credit, the relative economic vitality of the area in which the related properties are located, the average remaining life of the loans, the average size of the remaining loans, the servicing of the mortgage loans, possible changes in tax laws, other opportunities for investment, homeowner mobility and other economic, social,
geographic, demographic and legal factors. Consequently, such prepayment rates cannot be predicted with any certainty. In making investment decisions, we depend on certain assumptions based upon historical trends with respect to the relationship between interest rates and prepayments under normal market conditions. If the recent dislocations in the residential mortgage market or other developments change the way that prepayment trends have historically responded to interest rate changes, our ability to (1) assess the market value of target assets, (2) implement hedging strategies and (3) implement techniques to hedge prepayment risks would be significantly affected, which could materially adversely affect our financial position and results of operations. If we make erroneous assumptions regarding prepayment rates, we may experience significant investment losses.
A prolonged economic slowdown, a lengthy or severe recession or declining real estate values could impair our assets and harm our operations.
The risks associated with our business are more severe during periods of economic slowdown or recession, especially if these periods are accompanied by declining real estate values. The ability of a borrower to repay a loan secured by a residential property typically is dependent upon the income or assets of the borrower. During an economic slowdown, unemployment rises and increasing numbers of borrowers have difficulty in making payments on their debts, including on mortgage loans. When a recession is combined with declining real estate values, as has been the case in the recession that started in 2008, defaults on mortgages may increase dramatically.
Owners of Agency RMBS are protected from the risk of default on the underlying mortgages by guarantees from Fannie Mae, Freddie Mac or, in the case of the Ginnie Mae, the U.S. Government. However, we also acquire non-Agency RMBS, which are backed by residential real property but, in contrast to Agency RMBS, the principal and interest payments are not guaranteed by GSEs or the U.S. Government. Our non-Agency RMBS investments are therefore particularly sensitive to recessions and declining real estate values.
In the event of a default on a mortgage underlying a non-Agency RMBS in our portfolio, we bear the risk of loss as a result of the potential deficiency between the value of the collateral and the debt owed on the mortgage, as well as the costs and delays of foreclosure or other remedies, the costs of maintaining and ultimately selling a property after foreclosure.
Any sustained period of increased payment delinquencies, defaults, foreclosures or losses on our non-Agency RMBS could adversely affect our revenues, results of operations, financial condition, business prospects and ability to make distributions to stockholders.
We acquire RMBS collateralized by subprime mortgage loans, which are subject to increased risks.
Among other assets, we acquire RMBS backed by collateral pools of subprime mortgage loans, which are mortgage loans that have been originated using underwriting standards that are less conservative than those used in underwriting prime mortgage loans (mortgage loans that generally conform to GSE underwriting guidelines) and Alt-A mortgage loans (mortgage loans made to borrowers whose qualifying mortgage characteristics do not conform to GSE underwriting guidelines and generally allow homeowners to qualify for a mortgage loan with reduced or alternate forms of documentation). These lower standards include mortgage loans made to borrowers having imperfect or impaired credit histories, mortgage loans where the amount of the loan at origination is 80% or more of the value of the mortgage property, mortgage loans made to borrowers with low credit scores, mortgage loans made to borrowers who have other debt that represents a large portion of their income and mortgage loans made to borrowers whose income is not required to be disclosed or verified. Due to economic conditions, including increased interest rates and lower home prices, as well as aggressive lending practices, subprime mortgage loans have in recent periods experienced increased rates of delinquency, foreclosure, bankruptcy and loss, and they are likely to continue to experience delinquency, foreclosure, bankruptcy and loss rates that may be substantially higher, than those experienced by mortgage loans underwritten in a more traditional manner. In acquiring these assets, we endeavor to factor the risk of losses on the underlying mortgages into the purchase price of the asset. If we underestimate those losses, however, the performance of RMBS backed by subprime mortgage loans that we acquire could be adversely affected, which could adversely affect our results of operations, financial condition and business.
Our portfolio of assets may be concentrated in terms of credit risk.
Although as a general policy we seek to acquire and hold a diverse portfolio of assets, we are not required to observe specific diversification criteria, except as may be set forth in the investment guidelines adopted by our board of directors. Therefore, our asset portfolio may at times be concentrated in certain property types that are subject to higher risk of foreclosure, or secured by properties concentrated in a limited number of geographic locations. To the extent that our portfolio is concentrated in any one region or type of security, downturns relating generally to such region or type of security may result in defaults on a number of our assets within a short time period, which may reduce our net income and the value of our shares or warrants and accordingly reduce our ability to pay dividends to our stockholders. The portfolio may contain other concentrations of risk, and we may fail to identify, detect or hedge against those risks, resulting in large or unexpected losses.
Our subordinated RMBS assets may be in the “first loss” position, subjecting us to greater risk of losses.
We invest in certain tranches of RMBS that are only entitled to a portion of the principal and interest payments made on mortgage loans underlying the securities issued by the trust. In general, losses on a mortgage loan included in such a trust will be borne first by the equity holder of the issuing trust, and then by the “first loss” subordinated security holder and then by the “second loss” mezzanine holder. We may acquire securities at every level of such a trust, from the equity holder to the most senior tranche. In the event of default and the exhaustion of any classes of securities junior to those which we acquire, our securities will suffer losses as well. In addition, if we overvalue the underlying mortgage portfolio, or if the values subsequently decline and, as a result, less collateral is available to satisfy interest and principal payments due on the related RMBS, the securities which we acquire may effectively become the “first loss” position behind the more senior securities, which may result in significant losses. The prices of lower credit quality securities are generally less sensitive to interest rate changes than more highly rated securities, but more sensitive to adverse economic downturns or individual issuer developments. A projection of an economic downturn could cause a decline in the value of lower credit quality securities because the ability of obligors of mortgages underlying RMBS to make principal and interest payments may be impaired. In such event, existing credit support in the securitization structure may be insufficient to protect us against loss of our principal on these securities.
Increases in interest rates could adversely affect the value of our assets and cause our interest expense to increase, which could result in reduced earnings or losses and negatively affect our profitability as well as the cash available for distribution to stockholders.
Our operating results will depend in large part on the difference between the income from our assets, net of credit losses, and financing costs. We anticipate that, in many cases, the income from our assets will respond more slowly to interest rate fluctuations than the cost of our borrowings. Consequently, changes in interest rates, particularly short-term interest rates, may significantly influence our financial results.
Interest rates are highly sensitive to many factors, including governmental monetary and tax policies, domestic and international economic and political considerations and other factors beyond our control. Interest rate fluctuations present a variety of risks, including the risk of a narrowing of the difference between asset yields and borrowing rates, flattening or inversion of the yield curve and fluctuating prepayment rates.
In a normal yield curve environment, fixed income assets, including many RMBS, decline in value if interest rates increase. If long-term rates increased significantly, not only will the market value of these assets be expected to decline, but the duration and weighted-average life of the assets could increase as well because borrowers are less likely to prepay mortgages. Further, an increase in short-term interest rates would increase the rate of interest payable on any repurchase agreements required to finance these securities.
We endeavor to hedge our exposure to changes in interest rates, but there can be no assurances that our hedges will be successful, or that we will be able to enter into or maintain such hedges. As a result, interest rate fluctuations can cause significant losses, reductions in income, and limitations on our cash available for distribution to stockholders.
An increase in interest rates may cause a decrease in the volume of certain of our target assets, which could adversely affect our ability to acquire target assets that satisfy our investment objectives and to generate income and pay dividends.
Rising interest rates generally reduce the demand for mortgage loans due to the higher cost of borrowing. A reduction in the volume of mortgage loans originated may affect the volume of target assets available to us, which could adversely affect our ability to acquire assets that satisfy our investment objectives. Rising interest rates may also cause our target assets that were issued prior to an interest rate increase to provide yields that are below prevailing market interest rates. If rising interest rates cause us to be unable to acquire a sufficient volume of our target assets with a yield that is above our borrowing cost, our ability to satisfy our investment objectives and to generate income and pay dividends may be materially and adversely affected.
The assets in our portfolio are recorded at fair value, however there may be substantial uncertainty as to the value of certain assets.
Some of the assets in our portfolio are not publicly traded. The fair value of securities and other assets that are not publicly traded may not be readily determinable. We value these assets quarterly at fair value, as determined in accordance with ASC 820, Fair Value Measurements and Disclosures, which may include unobservable inputs. Because such valuations are subjective, the fair value of certain of our assets may fluctuate over short periods of time and our determinations of fair value may differ materially from the values that would have been used if a ready market for these securities existed. The value of our common stock or warrants could be adversely affected if our determinations regarding the fair value of these assets are materially higher than the values that we ultimately realize upon their disposal.
Mortgage loan modification programs and future legislative action may adversely affect the value of, and the returns on, the assets that we acquire.
The U.S. Government, through the Federal Reserve, the Federal Housing Administration and the Federal Deposit
Insurance Corporation, has commenced implementation of programs designed to provide homeowners with assistance in avoiding residential mortgage loan foreclosures. The primary program that has been initiated is the Home Affordable Modification Program, or HAMP, which seeks to provide relief to homeowners whose mortgages are in foreclosure. The programs may involve, among other things, the modification of mortgage loans to reduce the principal amount of the loans or the rate of interest payable on the loans, or to extend the payment terms of the loans. Additionally, some members of Congress have indicated support for additional legislative relief for homeowners, including an amendment to bankruptcy laws to permit modification of mortgage loans in bankruptcy proceedings. Loan modifications may lead to fewer foreclosures, and reduce the losses on non-Agency RMBS arising from foreclosures, however loan modifications may also result in significant reductions in cash flows to the holders of the RMBS. We attempt to factor in the likelihood and potential consequences of loan modification programs in making our investment decisions, however we cannot assure you that our analysis will be correct. As a result, loan modification programs, as well as future legislative or regulatory actions that result in the modification of outstanding mortgage loans may adversely affect the value of, and the returns on, our assets.
The value of our RMBS may be adversely affected by deficiencies in servicing and foreclosure practices, as well as related delays in the foreclosure process.
Recent allegations of deficiencies in servicing and foreclosure practices among several large sellers and servicers of residential mortgage loans have raised various concerns relating to such practices. Among the concerns raised are issues relating to the improper execution of the documents used in foreclosure proceedings (so-called “robo signing”), inadequate documentation of transfers and registrations of mortgages and assignments of loans, improper modifications of loans, violations of representations and warranties at the date of securitization and failure to enforce put-backs.
As a result of alleged deficiencies in foreclosure practices, a number of servicers temporarily suspended foreclosure proceedings while they evaluated their foreclosure practices. Additionally, a group of state attorneys general and state bank and mortgage regulators representing all 50 states and the District of Columbia began reviewing foreclosure practices. It is possible that additional deficiencies in servicing and foreclosure practices will be identified as a result.
The integrity of the servicing and foreclosure processes are critical to the value of the mortgage loan portfolios underlying our RMBS, and our financial results could be adversely affected by deficiencies in the conduct of those processes. For example, resulting delays in the foreclosure process may adversely affect the values of, and our losses on, our non-Agency RMBS. Foreclosure delays may also increase the administrative expenses of the securitization trusts for the non-Agency RMBS, thereby reducing the amount of funds available for distribution to investors. In addition, the subordinate classes of securities issued by the securitization trusts may continue to receive interest payments while the defaulted loans remain in the trusts, rather than absorbing the default losses. This may reduce the amount of credit support available for the senior classes we own, thus possibly adversely affecting these securities.
While we believe that the sellers and servicers would be in violation of their servicing contracts to the extent that they have improperly serviced mortgage loans or improperly executed documents in foreclosure or bankruptcy proceedings, it may be difficult, expensive, and time consuming for us to enforce our contractual rights.
We are continuing to review these issues as they arise and as new information becomes available. At this time, however, it is not possible for us to predict how the servicing and foreclosure matters will affect our business or what actions or remedies, if any, are available to us to protect our interests. There can be no assurance that these servicing and foreclosure matters will not have an adverse impact on our results of operations and financial condition.
Risks Related to Two Harbors' Organization and Structure
Certain provisions of Maryland law could inhibit changes in control.
Certain provisions of the Maryland General Corporation Law, or the MGCL, may have the effect of deterring a third party from making a proposal to acquire us or of impeding a change in control under circumstances that otherwise could provide the holders of shares of our common stock with the opportunity to realize a premium over the then-prevailing market price of such shares.
We are subject to the “business combination” provisions of the MGCL that, subject to limitations, prohibit certain business combinations (including a merger, consolidation, share exchange, or, in circumstances specified in the statute, an asset transfer or issuance or reclassification of equity securities) between Two Harbors and an “interested stockholder” (defined generally as any person who beneficially owns 10% or more of our then outstanding voting stock or an affiliate or associate of Two Harbors who, at any time within the two-year period immediately prior to the date in question, was the beneficial owner of 10% or more of the voting power of our then outstanding stock) or an affiliate thereof for five years after the most recent date on which the stockholder becomes an interested stockholder. After the five-year prohibition, any business combination between Two Harbors and an interested stockholder generally must be recommended by our board of directors and approved by the affirmative vote of at least (1) 80% of the votes entitled to be cast by holders of outstanding shares of our voting stock; and (2) two-thirds of the votes entitled to be cast by holders of
voting stock of the corporation other than shares held by the interested stockholder with whom or with whose affiliate the business combination is to be effected or held by an affiliate or associate of the interested stockholder. These super-majority vote requirements do not apply if our common stockholders receive a minimum price, as defined under Maryland law, for their shares in the form of cash or other consideration in the same form as previously paid by the interested stockholder for its shares. These provisions of the MGCL do not apply to business combinations that are approved or exempted by a board of directors prior to the time that the interested stockholder becomes an interested stockholder. Pursuant to the statute, our board of directors has by resolution exempted business combinations (1) between Two Harbors and any person, provided that such business combination is first approved by our board of directors (including a majority of Two Harbors' directors who are not affiliates or associates of such person) and (2) between Two Harbors and Pine River or its affiliates. Consequently, the five-year prohibition and the super-majority vote requirements will not apply to business combinations between Two Harbors and any person. As a result, any person, including Pine River, may be able to enter into business combinations with Two Harbors that may not be in the best interests of our stockholders, without compliance with the super-majority vote requirements and the other provisions of the statute.
The “control share” provisions of the MGCL provide that “control shares” of a Maryland corporation (defined as voting shares of stock which, if aggregated with all other shares of stock owned by the acquirer or in respect of which the acquirer is able to exercise or direct the exercise of voting power (except solely by virtue of a revocable proxy), would entitle the acquirer to exercise one of three increasing ranges of voting power in electing directors) acquired in a “control share acquisition” (defined as the direct or indirect acquisition of ownership or control of “control shares”) have no voting rights except to the extent approved by Two Harbors' stockholders by the affirmative vote of at least two-thirds of all the votes entitled to be cast on the matter, excluding votes entitled to be cast by the acquirer of control shares, Two Harbors' officers and employees who are also our directors. Our bylaws contain a provision exempting from the control share acquisition statute any and all acquisitions by any person of shares of our stock. There can be no assurance that this provision will not be amended or eliminated at any time in the future.
The “unsolicited takeover” provisions of the MGCL (Title 3, Subtitle 8 of the MGCL) permit our board of directors, without stockholder approval and regardless of what is currently provided in our charter or bylaws, to implement takeover defenses, some of which (for example, a classified board) we do not currently have. These provisions may have the effect of inhibiting a third party from making an acquisition proposal for Two Harbors or of delaying, deferring or preventing a change in control of Two Harbors under circumstances that otherwise could provide the holders of shares of our common stock with the opportunity to realize a premium over the then current market price. Our charter contains a provision whereby Two Harbors has elected to be subject to the provisions of Title 3, Subtitle 8 of the MGCL relating to the filling of vacancies on its board of directors.
Our authorized but unissued shares of common and preferred stock and the ownership limitations contained in our charter may prevent a change in control.
Our charter authorizes Two Harbors to issue additional authorized but unissued shares of common or preferred stock. In addition, our board of directors may, with the approval of a majority of the entire board and without stockholder approval, amend our charter to increase or decrease the aggregate number of shares of our stock or the number of shares of stock of any class or series that Two Harbors has the authority to issue and classify or reclassify any unissued shares of common or preferred stock and set the terms of the classified or reclassified shares. As a result, our board may establish a series of shares of common or preferred stock that could delay or prevent a transaction or a change in control that might involve a premium price for shares of our common stock or otherwise be in the best interests of stockholders.
In addition, our charter contains restrictions limiting the ownership and transfer of shares of our common stock and other outstanding shares of capital stock. The relevant sections of our charter provide that, subject to certain exceptions, ownership of shares of our common stock by any person is limited to 9.8% by value or by number of shares, whichever is more restrictive, of our outstanding shares of common stock (the common share ownership limit), and no more than 9.8% by value or number of shares, whichever is more restrictive, of our outstanding capital stock (the aggregate share ownership limit). The common share ownership limit and the aggregate share ownership limit are collectively referred to herein as the “ownership limits.” These charter provisions will restrict the ability of persons to purchase shares in excess of the relevant ownership limits.
Our charter contains provisions that make removal of our directors difficult, which could make it difficult for stockholders to effect changes in management.
Our charter provides that, subject to the rights of any series of preferred stock, a director may be removed only by the affirmative vote of at least two-thirds of all the votes entitled to be cast generally in the election of directors. Our charter and bylaws provide that vacancies generally may be filled only by a majority of the remaining directors in office, even if less than a quorum. These requirements make it more difficult to change management by removing and replacing directors and may prevent a change in control that is in the best interests of stockholders.
Our rights and stockholders' rights to take action against directors and officers are limited, which could limit recourse in the event of actions not in the best interests of stockholders.
As permitted by Maryland law, our charter eliminates the liability of its directors and officers to Two Harbors and its stockholders for money damages, except for liability resulting from:
| |
• | actual receipt of an improper benefit or profit in money, property or services; or |
| |
• | a final judgment based upon a finding of active and deliberate dishonesty by the director or officer that was material to the cause of action adjudicated. |
In addition, pursuant to our charter we have agreed contractually to indemnify our present and former directors and officers for actions taken by them in those capacities to the maximum extent permitted by Maryland law. Further, our bylaws require us to indemnify each present or former director or officer, to the maximum extent permitted by Maryland law, who is made, or threatened to be made, a party to any proceeding because of his or her service to Two Harbors. As part of these indemnification obligations, we may be obligated to fund the defense costs incurred by our directors and officers.
Tax Risks
Our failure to qualify as a REIT would subject us to U.S. federal income tax and potentially increased state and local taxes, which would reduce the amount of our income available for distribution to its stockholders.
We operate in a manner that will enable us to qualify as a REIT and have elected to be taxed as a REIT for U.S. federal income tax purposes commencing with our taxable year ended December 31, 2009. We have not requested and do not intend to request a ruling from the Internal Revenue Service (the “IRS”) that we qualify as a REIT. The U.S. federal income tax laws governing REITs are complex, and judicial and administrative interpretations of the U.S. federal income tax laws governing REIT qualification are limited. To continue to qualify as a REIT, we must meet, on an ongoing basis, various tests regarding the nature of our assets and income, the ownership of our outstanding shares, and the amount of our distributions. Moreover, new legislation, court decisions or administrative guidance, in each case possibly with retroactive effect, may make it more difficult or impossible for us to qualify as a REIT. Thus, while we intend to operate so that we qualify as a REIT, given the highly complex nature of the rules governing REITs, the ongoing importance of factual determinations, and the possibility of future changes in our circumstances, no assurance can be given that we will so qualify for any particular year. These considerations also might restrict the types of assets that we can acquire in the future.
If we fail to qualify as a REIT in any taxable year, and do not qualify for certain statutory relief provisions, we would be required to pay U.S. federal income tax on our taxable income, and distributions to our stockholders would not be deductible by us in determining our taxable income. In such a case, we might need to borrow money or sell assets in order to pay taxes. Our payment of income tax would decrease the amount of income available for distribution to stockholders. Furthermore, if we fail to maintain our qualification as a REIT, we no longer would be required to distribute substantially all of our net taxable income to stockholders. In addition, unless we were eligible for certain statutory relief provisions, we could not re-elect to be taxed as a REIT until the fifth calendar year following the year in which we failed to qualify.
Complying with REIT requirements may cause us to forego otherwise attractive investment opportunities or financing or hedging strategies.
In order to qualify as a REIT for U.S. federal income tax purposes, we must continually satisfy various tests on an annual and quarterly basis regarding the sources of our income, the nature and diversification of our assets, the amounts we distribute to stockholders and the ownership of our stock. To meet these tests, we may be required to forego investments we might otherwise make. We may be required to make distributions to stockholders at disadvantageous times or when we do not have funds readily available for distribution, and may be unable to pursue investments that would be otherwise advantageous to us in order to satisfy the source of income or asset diversification requirements for qualifying as a REIT. Thus, compliance with the REIT requirements may hinder our investment performance.
Complying with REIT requirements may force us to liquidate otherwise profitable assets.
In order to continue to qualify as a REIT, we must ensure that at the end of each calendar quarter, at least 75% of the value of our assets consists of cash, cash items, government securities and designated real estate assets, including certain mortgage loans and shares in other REITs. Subject to certain exceptions, our ownership of securities, other than government securities and securities that constitute real estate assets, generally cannot include more than 10% of the outstanding voting securities of any one issuer or more than 10% of the total value of the outstanding securities of any one issuer. In addition, in general, no more than 5% of the value of our assets, other than government securities and securities that constitute real estate assets, can consist of the securities of any one issuer, and no more than 25% of the value of our total securities can be represented by securities of one or more TRS's. If we fail to comply with these requirements at the end of any calendar quarter after the first calendar quarter for which we qualified as a REIT, we must generally correct such failure within 30 days after the end of such calendar quarter to avoid losing our REIT qualification. As a result, we may be required to liquidate otherwise profitable assets prematurely, which could reduce our return on assets, which could adversely affect returns to stockholders.
Potential characterization of distributions or gain on sale may be treated as unrelated business taxable income to tax exempt investors.
If (i) all or a portion of our assets are subject to the rules relating to taxable mortgage pools, (ii) we are a “pension held REIT,” (iii) a tax exempt stockholder has incurred debt to purchase or hold our common stock, or (iv) we purchase residual REMIC interests that generate “excess inclusion income,” then a portion of the distributions to and, in the case of a stockholder described in clause (iii), gains realized on the sale of common stock by such tax exempt stockholder may be subject to U.S. federal income tax as unrelated business taxable income under the Code.
Complying with REIT requirements may limit our ability to hedge effectively.
The REIT provisions of the Code may limit our ability to hedge our assets and operations. Under these provisions, on an annual basis we must derive 75% of our gross income from real estate assets, and 95% of our income from real estate assets and certain other qualifying income sources, in order to maintain our REIT status. Any income that we generate from transactions intended to hedge our interest rate and currency risks will generally be excluded from gross income for purposes of the 75% and 95% gross income tests if the instrument hedges interest rate risk or foreign currency exposure on liabilities used to carry or acquire real estate or income or gain that would be qualifying income under the 75% or 95% gross income tests, and such instrument is properly identified under applicable Treasury regulations. In addition, any income from other hedges would generally constitute non-qualifying income for purposes of both the 75% and 95% gross income tests. As a result of these rules, we may have to limit our use of hedging techniques that might otherwise be advantageous, which could result in greater risks associated with interest rate or other changes than we would otherwise incur.
The failure of a loan which is subject to a repurchase agreement to qualify as a real estate asset would adversely affect our ability to qualify as a REIT.
We may enter into repurchase agreements under which we will nominally sell certain of our loan assets to a counterparty and simultaneously enter into an agreement to repurchase the sold assets. We believe that we will be treated for U.S. federal income tax purposes as the owner of the real estate backed assets that are the subject of any such agreement notwithstanding that such agreements may transfer record ownership of the assets to the counterparty during the term of the agreement. It is possible, however, that the IRS could assert that we did not own the real estate backed assets during the term of the repurchase agreement, in which case we could fail to qualify as a REIT.
REIT distribution requirements could adversely affect our ability to execute our business plan and may require us to incur debt, sell assets or take other actions to make such distributions.
In order to continue to qualify as a REIT, we must distribute to stockholders, each calendar year, at least 90% of our REIT taxable income (including certain items of non-cash income), determined without regard to the deduction for dividends paid and excluding net capital gain. To the extent that we satisfy the 90% distribution requirement, but distribute less than 100% of our taxable income, we will be subject to U.S. federal corporate income tax on our undistributed income. In addition, we will incur a 4% nondeductible excise tax on the amount, if any, by which our distributions in any calendar year are less than a minimum amount specified under U.S. federal income tax law.
We intend to distribute our net income to stockholders in a manner intended to satisfy the 90% distribution requirement and to avoid both corporate income tax and the 4% nondeductible excise tax. Our taxable income may substantially exceed our net income as determined by GAAP or differences in timing between the recognition of taxable income and the actual receipt of cash may occur in which case we may have taxable income in excess of cash flow from our operating activities. In such event, we may generate less cash flow than taxable income in a particular year and find it difficult or impossible to meet the REIT distribution requirements in certain circumstances. In such circumstances, in order to satisfy the distribution requirement and to avoid U.S. federal corporate income tax and the 4% nondeductible excise tax in that year, we may be required to: (i) sell assets in adverse market conditions, (ii) borrow on unfavorable terms, (iii) distribute amounts that would otherwise be invested in future acquisitions, capital expenditures or repayment of debt or (iv) make a taxable distribution of our shares as part of a distribution in which stockholders may elect to receive shares or (subject to a limit measured as a percentage of the total distribution) cash, in order to comply with the REIT distribution requirements. Thus, compliance with the REIT distribution requirements may require us to take actions that may not otherwise be advisable given existing market conditions and hinder our ability to grow, which could adversely affect the value of our common stock or warrants.
Even though we have elected to be taxed as a REIT, we may be required to pay certain taxes.
Even though we have elected to be taxed as a REIT, we may be subject to certain U.S. federal, state and local taxes on our income and assets, including taxes on any undistributed income, prohibited transactions, tax on income from some activities conducted as a result of a foreclosure, and state or local income, franchise, property and transfer taxes, including mortgage recording taxes. In addition, we will hold some of our assets through taxable subsidiary corporations, including Capitol and other TRS's. Capitol and any other TRS's or other taxable corporations in which we own an interest will be subject to U.S. federal, state and local corporate taxes. Payment of these taxes generally would reduce our cash flow and
the amount available to distribute to stockholders.
Our ability to invest in and dispose of TBA securities could be limited by our REIT qualification, and we could fail to qualify as a REIT as a result of these investments.
We may purchase Agency RMBS through TBAs, or dollar roll transactions. In certain instances, rather than take delivery of the Agency RMBS subject to a TBA, we may dispose of the TBA through a dollar roll transaction in which we agree to purchase similar securities in the future at a predetermined price or otherwise, which may result in the recognition of income or gains. We will account for dollar roll transactions as purchases and sales. The law is unclear regarding whether TBAs will be qualifying assets for the 75% asset test and whether income and gains from dispositions of TBAs will be qualifying income for the 75% gross income test.
Unless we are advised by counsel that TBAs should be treated as qualifying assets for purposes of the 75% asset test, we will limit our REIT investment in TBAs and any other non-qualifying assets to no more than 25% of our total assets at the end of any calendar quarter. Furthermore, until we are advised by counsel that income and gains from the disposition of TBAs should be treated as qualifying income for purposes of the 75% gross income test, we will limit our REIT gains from dispositions of TBAs and any other non-qualifying income to no more than 25% of our total gross income for each calendar year. Accordingly, our ability within the REIT to purchase Agency RMBS through TBAs and to dispose of TBAs, through dollar roll transactions or otherwise, could be limited.
Moreover, even if we are advised by counsel that TBAs should be treated as qualifying assets or that income and gains from dispositions of TBAs should be treated as qualifying income, it is possible that the IRS could successfully take the position that such assets are not qualifying assets and such income is not qualifying income. In that event, we could be subject to a penalty tax or could fail to qualify as a REIT if (i) the value of our TBAs, together with our non-qualifying assets for the 75% asset test, exceeded 25% of our gross assets at the end of any calendar quarter, or (ii) our income and gains from the disposition of TBAs, together with our non-qualifying income for the 75% gross income test, exceeded 25% of our gross income for any taxable year.
Although our use of TRS's may be able to partially mitigate the impact of meeting the requirements for qualification as a REIT, our ownership of and relationship with our TRS's is limited and a failure to comply with the limits would jeopardize our REIT qualification and may result in the application of a 100% excise tax.
A REIT may own up to 100% of the stock of one or more TRS's. Other than certain activities relating to lodging and healthcare facilities, a TRS generally may engage in any business and may hold assets and earn income that would not be qualifying assets or income if held or earned directly by a REIT. Overall, no more than 25% of the value of a REIT's assets may consist of stock or securities of one or more TRS's. In addition, the TRS rules limit the deductibility of interest paid or accrued by a TRS to its parent REIT to assure that the TRS is subject to an appropriate level of corporate taxation. The rules also impose a 100% excise tax on certain transactions between a TRS and its parent REIT that are not conducted on an arm's-length basis.
Capitol and other TRS's that we may form will pay U.S. federal, state and local income tax on their taxable income, and their after-tax net income will be available for distribution to Two Harbors but are not required to be distributed to Two Harbors. We anticipate that the aggregate value of the securities of our TRS's will be less than 25% of the value of our total assets (including our TRS securities). Furthermore, we intend to monitor the value of our respective investments in our TRS's for the purpose of ensuring compliance with TRS ownership limitations. In addition, we will review all of our transactions with TRS's to ensure that they are entered into on arm's-length terms to avoid incurring the 100% excise tax described above. There can be no assurance, however, that we will be able to comply with the 25% limitation or to avoid application of the 100% excise tax discussed above.
We may be required to report taxable income with respect to certain of our investments in excess of the economic income we ultimately realize from them.
We may acquire interests in debt instruments in the secondary market for less than their face amount. The discount at which such interests in debt instruments are acquired may reflect doubts about their ultimate collectability rather than current market interest rates. The amount of such discount may nevertheless be treated as “market discount” for U.S. federal income tax purposes. Market discount on a debt instrument may accrue based on the assumption that all future payments on the debt instrument will be made. Accrued market discount is reported as income when, and to the extent that, any payment of principal of the debt instrument is made. In the case of residential mortgage loans, principal payments are ordinarily made monthly, and consequently, accrued market discount may have to be included in income each month as if the debt instrument were assured of ultimately being collected in full. If we collect less on a debt instrument than its purchase price plus the market discount we had previously reported as income, we may not be able to benefit from any offsetting loss deduction in a subsequent taxable year.
Similarly, some of the mortgage-backed securities that we purchase will likely have been issued with original issue discount, or OID. We may be required to report such OID based on a constant yield method and income would accrue over the period we own the underlying security. This may lead to an accrual of OID income in excess of the amount that is
collected. An offsetting loss deduction will become available only in the later year in which uncollectability is provable or ultimate disposition; and may be subject to limitation.
Finally, in the event that any debt instruments or mortgage-backed securities acquired by us are delinquent as to mandatory principal and interest payments, or in the event a borrower with respect to a particular debt instrument acquired by us encounters financial difficulty rendering it unable to pay stated interest as due, we may nonetheless be required to continue to recognize the unpaid interest as taxable income as it accrues, despite doubt as to its ultimate collectability. Similarly, we may be required to accrue interest income with respect to subordinate mortgage-backed securities at their stated rate regardless of whether corresponding cash payments are received or are ultimately collectible. In each case, while we would in general ultimately have an offsetting loss deduction available to us when such interest was determined to be uncollectable; the utility of that deduction would depend on our having taxable income in that later year or thereafter subject to carryforward limitations.
Dividends payable by REITs generally do not qualify for the reduced tax rates on dividend income from regular corporations, which could adversely affect the value of our shares or warrants.
Legislation enacted in 2003 generally reduces the maximum U.S. federal income tax rate for dividends payable to domestic stockholders that are individuals, trusts and estates to 15% through 2012 (under current law). Dividends payable by REITs, however, are generally not eligible for the reduced rates. Although the reduced U.S. federal income tax rate applicable to dividend income from regular corporate dividends does not adversely affect the taxation of REITs or dividends paid by REITs, the more favorable rates applicable to regular corporate dividends could cause investors who are individuals, trusts and estates to perceive investments in REITs to be relatively less attractive than investments in the stocks of non-REIT corporations that pay dividends, which could adversely affect the value of the shares of REITs, including Two Harbors' shares. Also, to the extent that tax rates change after 2012, the attractiveness of an investment in our shares may decrease, which could adversely affect the value of our securities.
We may be subject to adverse legislative or regulatory tax changes that could reduce the market price of our shares or warrants.
At any time, the U.S. federal income tax laws or regulations governing REITs or the administrative interpretations of those laws or regulations may be changed, possibly with retroactive effect. We cannot predict if or when any new U.S. federal income tax law, regulation or administrative interpretation, or any amendment to any existing U.S. federal income tax law, regulation or administrative interpretation, will be adopted, promulgated or become effective or whether any such law, regulation or interpretation may take effect retroactively. We and our stockholders or warrantholders could be adversely affected by any such change in, or any new, U.S. federal income tax law, regulation or administrative interpretation.
Risks Related to Our Securities
Future issuances and sales of shares of our common stock may depress the market price of our common stock or warrants or have adverse consequences for our stockholders or warrantholders.
Our charter provides that we may issue up to 450,000,000 shares of common stock. As of December 31, 2010, 40,501,212 shares of common stock were issued and outstanding and 33,249,000 warrants to purchase up to 33,249,000 shares of common stock were issued and outstanding. Additionally, our 2009 equity incentive plan provides for grants of restricted common stock and other equity-based awards, subject to a ceiling of 200,000 shares available for issuance under the plan. As of December 31, 2010, we have granted an aggregate of 58,622 shares of restricted common stock to our independent directors pursuant to the 2009 equity incentive plan, of which 7,387 shares have vested and 51,235 shares remain subject to vesting restrictions.
We cannot predict the effect, if any, of future issuances or sales of our common stock on the market price of our common stock or warrants. Sales of substantial amounts of common stock or the perception that such sales could occur may adversely affect the prevailing market price for our common stock or warrants.
Also, we may issue additional shares in subsequent public offerings or private placements to acquire new assets or for other purposes. We are not required to offer any such shares to existing stockholders on a preemptive basis. Therefore, it may not be possible for existing stockholders to participate in such future share issuances, which may dilute the existing stockholders' interests.
We have not established a minimum distribution payment level and we cannot assure you of our ability to pay distributions in the future.
We intend to continue to pay quarterly distributions and to make distributions to our stockholders in an amount such that we distribute all or substantially all of our REIT taxable income in each year, subject to certain adjustments. We have not established a minimum distribution payment level and our ability to pay distributions may be adversely affected by a number of factors, including the risk factors described herein. All distributions will be made, subject to Maryland law, at the discretion of our board of directors and will depend on our earnings, our financial condition, any debt covenants,
maintenance of our REIT qualification and other factors as our board of directors may deem relevant from time to time. We cannot assure you that we will achieve results that will allow us to make a specified level of cash distributions.
Our warrants may be exercised in the future, which would increase the number of shares of our common stock eligible for future resale in the public market.
Outstanding redeemable warrants to purchase an aggregate of 26,249,000 shares of our common stock (issued in connection with the conversion, pursuant to the merger, of the Capitol warrants issued in Capitol's initial public offering) and warrants to purchase an aggregate of 7,000,000 shares of common stock (issued in connection with the conversion, pursuant to the merger, of the warrants sold to Capitol's officers, directors and stockholders prior to Capitol's initial public offering simultaneously with the consummation of such initial public offering) are currently exercisable at an exercise price of $11.00 per share. The warrant exercise price may be lowered under certain circumstances, including, among others, in our sole discretion at any time prior to the expiration date of the warrants for a period of not less than ten business days; provided, however, that any such reduction shall be identical in percentage terms among all of the warrants. These warrants likely will be exercised if the market price of the shares of our common stock equals or exceeds the warrant exercise price. Therefore, as long as warrants remain outstanding, there will be a drag on any increase in the price of our common stock in excess of the warrant exercise price. To the extent such warrants are exercised, additional shares of our common stock will be issued, which would dilute the ownership of existing stockholders. Further, if these warrants are exercised at any time in the future at a price lower than the book value per share of our common stock, existing stockholders could suffer substantial dilution of their investment, which dilution could increase in the event the warrant exercise price is lowered. Additionally, if we were to lower the exercise price in the near future, the likelihood of this dilution could be accelerated.
The market price of our securities could fluctuate and could cause you to lose a significant part of your investment.
The market price of our securities may be influenced by many factors, some of which are beyond our control, including those described above and the following:
| |
• | changes in financial estimates by analysts; |
| |
• | fluctuations in our quarterly financial results or the quarterly financial results of companies perceived to be similar to us; |
| |
• | general economic conditions; |
| |
• | changes in market valuations of similar companies; |
| |
• | regulatory developments in the United States; and |
| |
• | additions or departures of key personnel at Pine River. |
Resulting fluctuations in the market price of our securities could cause you to lose a significant part of your investment.
Item 1B. Unresolved Staff Comments
None.
Item 2. Properties
We do not own any real property. Our executive and administrative office is located at 601 Carlson Parkway, Suite 330, Minnetonka, Minnesota 55305, telephone (612) 238-3300. We also utilize an office at 590 Madison Avenue, Suite 3703, New York, NY 10021, which primarily supports our investment operations. We share these office spaces with Pine River in accordance with the shared facilities and services agreement between PRCM Advisers LLC and Pine River.
Item 3. Legal Proceedings
As of the date of this filing, we are not party to any litigation or legal proceedings, or to the best of our knowledge, any threatened litigation or legal proceedings, which, in our opinion, individually or in the aggregate, would have a material adverse effect on our results of operations or financial condition.
Item 4. [Removed and Reserved]
PART II
Item 5. Market for Registrant's Common Equity, Related Stockholder Matters, and Issuer Purchases of Equity Securities
Market Information
Prior to the consummation of the merger with Capitol on October 28, 2009, there had been no public trading market for our common stock or warrants. As of the date of this filing, our common stock is listed on the NYSE and our warrants are listed on the NYSE Amex under the symbols “TWO” and “TWO.WS,” respectively. As of December 31, 2010, and as of the date of this filing, 40,501,212 shares of common stock and 33,249,000 warrants were issued and outstanding.
The following table shows the high and low sales prices per the New York Stock Exchange composite tape for our common stock and warrants on the NYSE Amex during the calendar year ended December 31, 2010 and December 31, 2009:
| | | | | | | | | | | | | | | | |
Three Months Ended | | Common Stock | | Warrants |
| | High | | Low | | High | | Low |
December 31, 2010 | | $ | 10.35 | | | $ | 8.85 | | | $ | 0.28 | | | $ | 0.10 | |
September 30, 2010 | | $ | 9.41 | | | $ | 8.13 | | | $ | 0.39 | | | $ | 0.10 | |
June 30, 2010 | | $ | 9.32 | | | $ | 8.00 | | | $ | 0.30 | | | $ | 0.15 | |
March 31, 2010 | | $ | 10.23 | | | $ | 8.71 | | | $ | 0.50 | | | $ | 0.25 | |
December 31, 2009 | | $ | 10.10 | | | $ | 8.70 | | | $ | 0.75 | | | $ | 0.40 | |
Holders
As of February 28, 2011, we had 2 registered holders and approximately 10,800 beneficial owners of our common stock, and we had 14 registered holders and approximately 329 beneficial owners of our warrants. Such information was obtained through our registrar and transfer agent, based on the results of a broker search.
Dividends
On December 8, 2010, we declared dividends to common stockholders totaling $10.5 million, or $0.40 per share. The following table presents cash dividends declared on our common stock from October 28, 2009 through December 31, 2010:
| | | | | | | | |
Declaration Date | | Record Date | | Payment Date | | Cash Dividend Per Share |
December 8, 2010 | | December 17, 2010 | | January 20, 2011 | | $ | 0.40 | |
September 13, 2010 | | September 30, 2010 | | October 21, 2010 | | $ | 0.39 | |
June 14, 2010 | | June 30, 2010 | | July 22, 2010 | | $ | 0.33 | |
March 12, 2010 | | March 31, 2010 | | April 23, 2010 | | $ | 0.36 | |
December 21, 2009 | | December 31, 2009 | | January 26, 2010 | | $ | 0.26 | |
All dividend distributions are made with the authorization of the board of directors at its discretion and will depend on such items as our REIT taxable earnings, financial condition, maintenance of REIT status, and other factors that the board of directors may deem relevant from time to time. The holders of our common stock share proportionally on a per share basis in all declared dividends on common stock. We intend to pay quarterly dividends and intend to distribute to our stockholders as dividends at least 90% of our REIT taxable income.
We have not established a minimum payout level for our common stock. See Item 1A, “Risk Factors,” and Item 7, “Management's Discussion and Analysis of Financial Conditions and Results of Operations,” of this Annual Report on Form 10-K, for information regarding the sources of funds used for dividends and for a discussion of factors, if any, which may adversely affect our ability to pay dividends at the same level in 2011 and thereafter.
Our stock transfer agent and registrar is The Bank of New York Mellon, or BNY Mellon. Requests for information from BNY Mellon can be sent to BNY Mellon Shareowner Services, P.O. Box 358035, Pittsburgh, PA 15252-8035 and their telephone number is 1-800-851-9677.
Securities Authorized for Issuance under Equity Compensation Plans
We have adopted an equity incentive plan in 2009 to provide incentive compensation to attract and retain qualified directors, officers, advisers, consultants and other personnel, including PRCM Advisers LLC and affiliates and personnel of PRCM Advisers LLC and its affiliates, and any joint venture affiliates of ours. The 2009 equity incentive plan is administered by the compensation committee of our board of directors. The 2009 equity incentive plan permits the granting of restricted shares of common stock, phantom shares, dividend equivalent rights and other equity-based awards. For a detailed description of the 2009 equity incentive plan, see Note 11 - Equity Incentive Plan of the consolidated financial statements included under Item 8 of this Annual Report on Form 10-K.
On October 28, 2009, we granted 22,159 shares of restricted common stock to our independent directors pursuant to our 2009 equity incentive plan. The estimated fair value of these awards was $9.59 per share, based on the closing price of Capitol's common stock on the NYSE Amex on such date. An additional 36,463 shares of restricted common stock was granted on June 14, 2010. The estimated fair value of these awards was $8.57 per share, based on the closing price of TWO's common stock on the NYSE Amex on such date. The grants will vest in three annual installments commencing on the date of the grant, as long as such director is serving as a board member on the vesting date. Such grants were exempt from the registration requirements of the Securities Act pursuant to Section 4(2) thereof.
The following table presents certain information about our equity compensation plans as of December 31, 2010 and December 31, 2009, respectively:
| | | | | | | | | | | |
| | December 31, 2010 |
Plan Category | | Number of securities to be issued upon exercise of outstanding equity based share awards | | | Weighted-average exercise price of outstanding equity based share awards | | Number of securities remaining available for future issuance under equity compensation plans (excluding securities reflected in the first column of this table) |
Equity compensation plans approved by stockholders | | 51,235 | | (1) | | $ | — | | | 141,378 | |
Equity compensation plans not approved by stockholders | | — | | | | — | | | — | |
Total | | 51,235 | | | | $ | — | | | 141,378 | |
____________________
| |
(1) | Represents shares of restricted stock granted under the 2009 equity incentive plan which remain subject to vesting requirements. |
Purchases of Equity Securities by the Issuer and Affiliated Purchasers
We did not repurchase any of our common stock during the fiscal year ended December 31, 2010.
Performance Graph
The following graph compares the shareholder's cumulative total return, assuming $100 invested at October 28, 2009 (the date of our merger), with all reinvestment of dividends, as if such amounts had been invested in: (i) our common stock; (ii) the stocks included in the Standard and Poor's 500 Stock Index (“S&P 500”); (iii) the stocks included in the NAREIT Mortgage REIT Index; and an index of selected issuers in our Two Harbors REIT Peer group, composed of American Capital Agency Corp., Annaly Capital Management, Inc., Anworth Mortgage Asset Corporation, Capstead Mortgage Corporation, Chimera Investment Corporation, Cypress Sharpridge Investments, Inc., Hatteras Financial Corp., Invesco Mortgage Capital Inc., MFA Financial, Inc., PennyMac Mortgage Investment Trust, and Redwood Trust, Inc.
COMPARISON OF CUMULATIVE TOTAL RETURN
Among Two Harbors Investment Corp., S&P 500, NAREIT Mortgage
REIT Index, and Two Harbors REIT Peer Group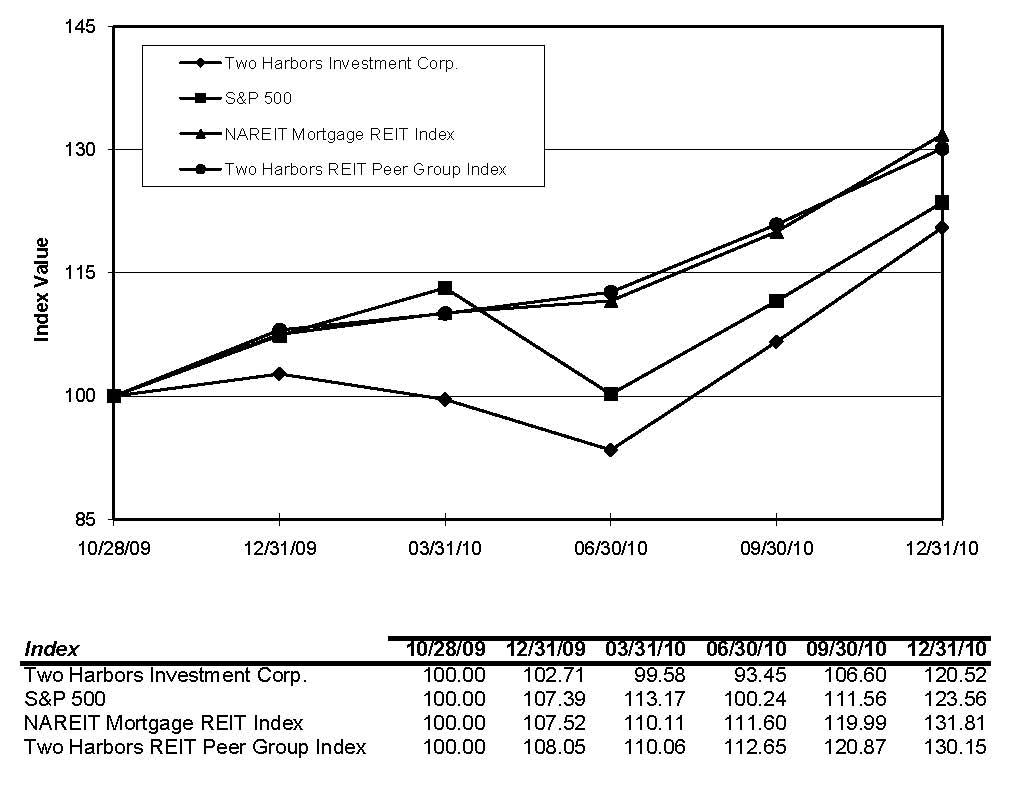
Item 6. Selected Financial Data
Our selected financial data set forth below should be read in conjunction with our consolidated financial statements and the accompanying notes, included under Item 8 of this Annual Report on Form 10-K. Certain amounts for prior periods have been reclassified to conform to the 2010 presentation.
| | | | | | | | | | | | | | | |
| At or for the Years Ended | | At or for the Period from June 26, 2007 (inception) through December 31, 2007(1) |
(in thousands, except share data) | December 31, | |
Income Statement Data: | 2010 | | 2009(1) | | 2008(1) | |
| | | | | | | |
Interest income: | | | | | | | | | |
Available-for-sale securities | $ | 39,844 | | | $ | 2,796 | | | $ | — | | | $ | — | |
Trading securities | 170 | | | — | | | — | | | — | |
Cash and cash equivalents | 107 | | | 70 | | | 4,443 | | | 1,474 | |
Total interest income | 40,121 | | | 2,866 | | | 4,443 | | | 1,474 | |
Interest expense | 4,421 | | | 131 | | | — | | | — | |
Net interest income | 35,700 | | | 2,735 | | | 4,443 | | | 1,474 | |
Other income: | | | | | | | |
Gain on investment securities, net | 6,127 | | | 336 | | | — | | | — | |
Gain (loss) on interest rate swap agreements | (6,344 | ) | | 364 | | | — | | | — | |
Gain on other derivative instruments | 7,156 | | | — | | | — | | | — | |
Total other income | 6,939 | | | 700 | | | — | | | — | |
Expenses: | | | | | | | |
Management fees | 2,989 | | | 326 | | | — | | | — | |
Other operating expenses | 4,578 | | | 12,171 | | | 1,060 | | | 141 | |
Total expenses | 7,567 | | | 12,497 | | | 1,060 | | | 141 | |
Net income (loss) before income taxes | 35,072 | | | (9,062 | ) | | 3,383 | | | 1,333 | |
Benefit from (provision for) income taxes | 683 | | | 318 | | | (1,088 | ) | | (618 | ) |
Net income (loss) | 35,755 | | | (8,744 | ) | | 2,295 | | | 715 | |
Accretion of Trust Account income relating to common stock subject to possible conversion | — | | | (93 | ) | | (236 | ) | | — | |
Net income (loss) attributable to common stockholders | $ | 35,755 | | | $ | (8,837 | ) | | $ | 2,059 | | | $ | 715 | |
Basic and diluted earnings (loss) per weighted average common share | $ | 1.60 | | | $ | (0.39 | ) | | $ | 0.08 | | | $ | 0.06 | |
Dividends declared per common share | $ | 1.48 | | | $ | 0.26 | | | $ | — | | | $ | — | |
Basic and diluted weighted average number of shares of common stock | 22,381,683 | | | 22,941,728 | | | 24,936,558 | | | 11,602,789 | |
| | | | | | | | | | | | | | | |
Balance Sheet Data: | | | | | | | |
Available-for-sale securities | $ | 1,354,405 | | | $ | 494,465 | | | $ | — | | | $ | — | |
Total assets | $ | 1,797,432 | | | $ | 538,366 | | | $ | 262,095 | | | $ | 260,304 | |
Repurchase agreements | $ | 1,169,803 | | | $ | 411,893 | | | $ | — | | | $ | — | |
Total stockholders' equity | $ | 382,448 | | | $ | 121,721 | | | $ | 184,162 | | | $ | 182,103 | |
____________________
| |
(1) | Capitol, the accounting acquirer in the merger completed on October 28, 2009 was formed on June 26, 2007 as a development stage company. As such, our results of operations are presented for only the periods set forth above. Comparability of the financial data is affected by the merger with Capitol. |
Item 7. Management's Discussion and Analysis of Financial Condition and Results of Operations
The following discussion and analysis should be read in conjunction with the consolidated financial statements and accompanying notes included elsewhere in this Annual Report on Form 10-K.
General
We are a Maryland corporation focused on investing in, financing and managing residential mortgage-backed securities, or RMBS, and related investments. We operate as a real estate investment trust, or REIT, as defined under the Internal Revenue Code of 1986, as amended, or the Code.
We are externally managed by PRCM Advisers LLC. PRCM Advisers is a wholly-owned subsidiary of Pine River Capital Management L.P., which we refer to as Pine River, a global multi-strategy asset management firm with an established track record of investing in our target assets and fixed income securities.
Our objective is to provide attractive risk-adjusted returns to our stockholders over the long term, primarily through dividends and secondarily through capital appreciation. We selectively acquire and manage an investment portfolio of our target assets, which we believe is constructed to generate attractive returns through market cycles. We focus on security selection and implement a relative value investment approach across various sectors within the residential mortgage market. Our target assets include the following:
| |
• | Agency RMBS, meaning RMBS whose principal and interest payments are guaranteed by the Government National Mortgage Association (or Ginnie Mae), the Federal National Mortgage Association (or Fannie Mae), or the Federal Home Loan Mortgage Corporation (or Freddie Mac); |
| |
• | Non-Agency RMBS, meaning RMBS that are not issued or guaranteed by Ginnie Mae, Fannie Mae or Freddie Mac; and |
| |
• | Financial assets other than RMBS, comprising approximately 5% to 10% of the portfolio. |
We seek to deploy moderate leverage as part of our investment strategy. We generally finance our target assets through short-term borrowings structured as repurchase agreements.
We compete with other investment vehicles for attractive investment opportunities. We rely on our management team and Pine River, who have developed strong relationships with a diverse group of financial intermediaries, to identify investment opportunities. In addition, we have benefited and expect to continue to benefit from Pine River's analytical and portfolio management expertise and infrastructure. We believe that our focus on the RMBS area, the extensive RMBS expertise of our investment team, our strong analytics and our disciplined relative value investment approach give us a competitive advantage over our peers.
We have elected to be treated as a REIT for U.S. federal income tax purposes. To qualify as a REIT we are required to meet certain investment and operating tests and annual distribution requirements. We generally will not be subject to U.S. federal income taxes on our taxable income to the extent that we annually distribute all of our net taxable income to stockholders, do not participate in prohibited transactions and maintain our intended qualification as a REIT. However, certain activities that we may perform may cause us to earn income which will not be qualifying income for REIT purposes. We have designated our subsidiary, Capitol, as a taxable REIT subsidiary, or TRS, as defined in the Code, to engage in such activities, and we may in the future form additional TRSs. We also operate our business in a manner that will permit us to maintain our exemption from registration under the Investment Company Act of 1940, as amended, or the 1940 Act.
Overview
Our 2010 efforts were focused on three strategic objectives that we believe position us for long term success.
| |
• | Managing a portfolio to generate attractive returns with balanced risks. Our portfolio approach manages to a low level of interest rate exposure and focuses on positive prepayment upside. Through a diversified portfolio of Agency and non-Agency RMBS in combination with derivative hedging instruments, we believe this balanced risk within our portfolio is critical to providing an attractive return to our stockholders. |
| |
• | Growing our stockholder base and market capitalization to enhance stockholder liquidity and reduce operating expense ratios. During 2010, we completed two secondary common stock offerings increasing our market capitalization to approximately $400 million as of December 31, 2010. By doing so, we achieved a corresponding increase in daily trading volume, further diversity in shareholder base, a lower expense ratio as a percentage of equity, and ultimately, successful transition of our common stock in February 2011 to the NYSE. |
| |
• | Deploying capital efficiently. After completion of our secondary stock offerings, our objective was to deploy |
capital rapidly but prudently, focusing on assets with attractive risk-adjusted returns. We believe we have accomplished this goal: our capital was fully invested as of January 2011 subsequent to the most recent December 2010 capital raise.
Factors Affecting our Operating Results
Our net interest income will include income from our RMBS portfolio and will reflect the amortization of purchase premiums and accretion of purchase discounts. Net interest income will fluctuate primarily as a result of changes in market interest rates, our financing costs, and prepayment speeds on our assets. Interest rates, financing costs and prepayment rates vary according to the type of investment, conditions in the financial markets, competition and other factors, none of which can be predicted with any certainty. Our operating results will also be affected by default rates and credit losses with respect to the mortgage loans underlying our non-Agency RMBS.
Fair Value Measurement
ASC 820 defines fair value as the price that would be received to sell an asset or paid to transfer a liability in an orderly transaction between willing market participants at the measurement date. It also establishes three levels of input to be used when measuring fair value:
| |
Level 1 | Inputs are quoted prices in active markets for identical assets or liabilities as of the measurement date. Additionally, the entity must have the ability to access the active market and the quoted prices cannot be adjusted by the entity. |
| |
Level 2 | Inputs include quoted prices in active markets for similar assets or liabilities; quoted prices in inactive markets for identical or similar assets or liabilities; or inputs that are observable or can be corroborated by observable market data by correlation or other means for substantially the full-term of the assets or liabilities. |
| |
Level 3 | Unobservable inputs are supported by little or no market activity. The unobservable inputs represent management's best assumptions of how market participants would price the assets and liabilities. Generally, Level 3 assets and liabilities are valued using pricing models, discounted cash flow methodologies, or similar techniques that require significant judgment or estimation. |
We follow the fair value hierarchy set forth above in order to prioritize the data utilized to measure fair value. We strive to obtain quoted market prices in active markets (Level 1 inputs). If Level 1 inputs are not available, we will attempt to obtain Level 2 inputs, observable market prices in inactive markets or derive the fair value measurement using observable market prices for similar assets or liabilities. When neither Level 1 nor Level 2 inputs are available, we use Level 3 inputs and independent pricing service models to estimate fair value measurements. At December 31, 2010, approximately 88.6% of total assets, or $1.6 billion, and $0.2 million of total liabilities consisted of financial instruments recorded at fair value. As of December 31, 2010, we had $8.6 million of total assets reported at fair value using Level 3 inputs. See Note 8 to the Consolidated Financial Statements, included in this Annual Report on Form 10-K, for descriptions of valuation methodologies used to measure material assets and liabilities at fair value and details of the valuation models, key inputs to those models and significant assumptions utilized.
A significant portion of our assets and liabilities are at fair value and therefore our consolidated balance sheet and income statement are significantly affected by fluctuations in market prices. Although we execute various hedging strategies to mitigate our exposure to changes in fair value, we cannot fully eliminate our exposure to volatility caused by fluctuations in market prices. Starting in 2007, markets for asset-backed securities, including RMBS, have experienced severe dislocations. While these market disruptions continue, our assets and liabilities will be subject to valuation adjustment as well as changes in the inputs we use to measure fair value.
For the three months ended December 31, 2010, our unrealized fair value gains on interest rate swap agreements, which are accounted for as derivatives trading instruments under GAAP, positively affected our financial results while, for the year ended December 31, 2010, our unrealized fair value losses on interest rate swap agreements negatively affected our financial results. The change in fair value of the interest rate swaps was a result of changes to LIBOR and corresponding counterparty borrowing rates during the year ended December 31, 2010. Our financial results for the three and twelve months ended December 31, 2010 were negatively affected by unrealized fair value losses on certain U.S. Treasuries classified as trading instruments due to their short-term investment objectives. In addition, our financial results were favorably affected by certain other derivative instruments entered into by us in the first period of 2010 that were accounted for as trading derivative instruments, i.e., TBAs and inverse interest-only securities. Any temporary change in the fair value of our available-for-sale securities is recorded as a component of accumulated other comprehensive income
and does not impact our earnings.
We have numerous internal controls in place to help ensure the appropriateness of fair value measurements. Significant fair value measures are subject to detailed analytics, management review and approval. Our entire investment portfolio is priced by third-party brokers at the “bid side” of the market, and/or by independent pricing providers. We strive to obtain multiple market data points for each valuation. By utilizing “bid side” pricing, certain assets, especially the most recent purchases, may realize a markdown due to the “bid-offer” spread. To the extent that this occurs, any economic effect of this would be reflected in accumulated other comprehensive income. We back test the fair value measurements provided by the pricing providers against actual performance. We also monitor the market for recent trades, market surveys, or other market information that may be used to benchmark pricing provider inputs.
Considerable judgment is used in forming conclusions and estimating inputs to our Level 3 fair value measurements. Level 3 inputs such as interest rate movements, prepayments speeds, credit losses and discount rates are inherently difficult to estimate. Changes to these inputs can have a significant effect on fair value measurements. Accordingly, we cannot be assured that our estimates of fair value are indicative of the amounts that would be realized on the ultimate sale or exchange.
Critical Accounting Estimates
The preparation of financial statements in accordance with GAAP requires us to make certain judgments and assumptions, based on information available at the time of our preparation of the financial statements, in determining accounting estimates used in preparation of the statements. Our significant accounting policies are described in Note 2 to the consolidated financial statements, included under Item 8 of this Annual Report on Form 10-K.
Accounting estimates are considered critical if the estimate requires us to make assumptions about matters that were highly uncertain at the time the accounting estimate was made and if different estimates reasonably could have been used in the reporting period or changes in the accounting estimate are reasonably likely to occur from period to period that would have a material impact on our financial condition, results of operations or cash flows.
Classification of Investment Securities and Valuations of Financial Instruments
Our RMBS investments consist primarily of Agency RMBS and non-Agency RMBS that we classify as available-for-sale. Our RMBS classified as available-for-sale are carried at their fair value, with changes in fair value recorded through accumulated other comprehensive income/(loss), a component of stockholders' equity, rather than through earnings. We also hold U.S. Treasuries for trading purposes. Our trading securities are carried at estimated fair value with changes in fair value recorded as a component of net gain (loss) on investment securities in earnings. If our RMBS securities were also classified as trading securities, there could be substantially greater volatility in our earnings.
When the estimated fair value of an available-for-sale security is less than amortized cost, we consider whether there is an other-than-temporary impairment in the value of the security is required to be recognized in the statement of operations. The determination of whether a security is other-than-temporarily impaired involves judgments and assumptions based on subjective and objective factors. Consideration is given to whether we (1) have the intent to sell the investment securities, (2) are more likely than not to be required to sell the investment securities before recovery, or (3) do not expect to recover the entire amortized cost basis of the investment securities. Investments with unrealized losses are not considered other-than-temporarily impaired if we have the ability and intent to hold the investments for a period of time, to maturity if necessary, sufficient for a forecasted market price recovery up to or beyond the amortized cost basis of the investments. If an impairment is determined to be solely driven by the inability to fully recover the entire amortized cost basis over the remaining life of the security, the security is further analyzed for credit loss (the difference between the present value of cash flows expected to be collected and the amortized cost basis). The credit loss, if any, is then recognized in the statement of operations, while the balance of impairment related to other factors is recognized in other comprehensive income.
The methods used by us to estimate fair value may produce a fair value calculation that may not be indicative of net realizable value or reflective of future fair values. Furthermore, while we believe that our valuation methods are appropriate and consistent with other market participants, the use of different methodologies, or assumptions, to determine the fair value of certain financial instruments could result in a different estimate of fair value at the reporting date. We use inputs that are current as of the measurement date, which in periods of market dislocation, may have reduced price transparency.
Interest Income Recognition
Our interest income on our Agency RMBS and non-Agency RMBS is accrued based on the actual coupon rate and the outstanding principal balance of such securities. Premiums and discounts are amortized or accreted into interest income over the lives of the securities using the effective yield method, as adjusted for actual prepayments. We estimate prepayments for our Agency interest-only securities, which represent our right to receive a specified portion of the contractual interest flows of specific Agency and CMO securities. As a result, if prepayments increase (or are expected to
increase), we will accelerate the rate of amortization on the premiums.
Our interest income on our non-Agency RMBS securities rated below AA, including unrated securities, is recognized in accordance with estimated cash flows. Cash flows from a security are estimated by applying assumptions used to determine the fair value of such security and the excess of the future cash flows over the investment are recognized as interest income under the effective yield method. We review and, if appropriate, make adjustments to our cash flow projections at least quarterly and monitor these projections based on input and analysis received from external sources, internal models, and our judgment about interest rates, prepayment rates, the timing and amount of credit losses, and other factors. Changes in cash flows from those originally projected, or from those estimated at the last evaluation, may result in a prospective change in interest income recognized on, or the carrying value of, such securities.
For non-Agency securities purchased at a discount, we account for differences between contractual cash flows and cash flows expected to be collected from our initial investment in debt securities acquired if those differences are attributable, at least in part, to credit quality. We limit the yield that may be accreted (accretable yield) to the excess of an estimate of undiscounted expected principal, interest, and other cash flows (cash flows expected at acquisition to be collected) over the initial investment. The excess of contractual cash flows over cash flows expected to be collected (nonaccretable difference or designated credit reserve) is not recognized as an adjustment of yield, loss accrual, or valuation allowance. Subsequent increases in cash flows expected to be collected is recognized prospectively through adjustment of the yield over the remaining life of the security. Decreases in cash flows expected to be collected are recognized as an impairment.
Derivative Financial Instruments and Hedging Activities
We apply the provisions of ASC 815, Derivatives and Hedging, which requires an entity to recognize all derivatives as either assets or liabilities in the balance sheets and to measure those instruments at fair value. The fair value adjustments of our current derivative instruments affect net income as the hedge for accounting purposes is being treated as an economic, or trading, hedge and not as a qualifying hedging instrument.
Derivatives are used for hedging purposes rather than speculation. We rely on internal models corroborated by quotations from a third party to determine these fair values. If our hedging activities do not achieve their desired results, our reported earnings may be adversely affected.
Income Taxes
Our financial results are generally not expected to reflect provisions for current or deferred income taxes, except for those taxable benefits or provisions recognized by our taxable REIT subsidiary. We estimate, based on existence of sufficient evidence, the ability to realize the remainder of any deferred tax asset our TRS recognizes. Any adjustments to such estimates will be made in the period such determination is made. We plan to operate in a manner that will allow us to qualify for taxation as a REIT. As a result of our expected REIT qualification, we do not generally expect to pay U.S. federal corporate level taxes. Many of the REIT requirements, however, are highly technical and complex. If we were to fail to meet the REIT requirements, we would be subject to U.S. federal, state and local income taxes.
Market Conditions and Outlook
The 2010 fiscal year provided a multitude of regulatory and market events, which allowed us to instill the benefits of our blended Agency and non-Agency RMBS risk-adjusted return strategies and demonstrate our ability to allocate capital in a nimble manner. While not intended to be comprehensive, a few of the more notable regulatory and market events are the following:
| |
• | In the first and second quarters of 2010, Freddie Mac and Fannie Mae announced their plans to purchase seriously delinquent (i.e., more than 120 days delinquent) loans out of existing mortgage pools, which were expected to increase prepayments on impacted agency pools. Our focus on analyzing public policy in the context of market conditions, coupled with appropriate diligence in selecting pools, enabled us to avoid any adverse impacts from the GSE buyouts and to maintain an attractive CPR on our agency portfolio. |
The following table provides the weighted average CPR on our Agency RMBS throughout 2010:
| | | | | | | | | | | | |
| | Three Months Ended |
Agency RMBS | | March 31, 2010 | | June 30, 2010 | | September 30, 2010 | | December 31, 2010 |
| | (Ratios for the quarter have been annualized) |
Weighted Average CPR | | 16.2 | % | | 12.5 | % | | 9.7 | % | | 8.0 | % |
| |
• | In an attempt to lower mortgage rates and enable borrowers to refinance and reduce their mortgage payments, the Federal Reserve established a program to purchase Agency RMBS, which commenced in January 2009 and was |
terminated on March 31, 2010. In total, $1.25 trillion of Agency RMBS was purchased. In November 2010 the Federal Reserve again announced a program to purchase an additional $600 billion of longer-term Treasury securities by the end of the second quarter of 2011, a pace of about $75 billion per month. Both of these programs impacted our view of opportunities and risks in the Agency RMBS market in 2010. Throughout these events, the management of prepayment risk has been a key component of our approach. We have focused on pools with prepayment characteristics with better prepayment characteristics than the overall market. We believe this focus will continue to provide for both slower and more stable prepayment speeds relative to the market over time, especially given the current historically low level of mortgage rates.
| |
• | The FHA and the FDIC government programs, to provide homeowners with assistance in avoiding residential mortgage loan foreclosures, continue to be in effect, including the Home Affordable Mortgage Modification Program, or HAMP, among other programs. These homeowner assistance programs may involve the modification of mortgage loans to reduce the principal amount of the loans (through forbearance and/or forgiveness) or the rate of interest payable on the loans, or may extend the payment terms of the loans. They may also allow for streamlined financing, thus increasing prepayments, or for a delay in foreclosures, thus potentially altering the timing and amount of cash flows to certain securities. In general, these homeowner assistance programs, as well as future legislative or regulatory actions, may affect the value of, and the returns on, our RMBS portfolio. To the extent that these programs are successful and fewer borrowers default on their mortgage obligations, the actual default rates realized on our non-Agency RMBS may be less than the default assumptions made by us at the purchase of such non-Agency RMBS. This could cause the realized yields on our non-Agency RMBS portfolio to be higher than expected at time of purchase. Conversely, if these programs lead to forced reductions in principal, certain RMBS could be affected and decrease in value. |
| |
• | In early fourth quarter of 2010, there were significant market discussions around documentation issues surrounding the residential mortgage loan foreclosure process and the ability to put back loans that were securitized. Generally, this market news had minimal pricing impact on non-Agency RMBS in the fourth quarter of 2010 while there was some slowing of foreclosures and ultimately prepayment speeds in our non-Agency RMBS. These delays are currently viewed to be short-term in nature, although, it is anticipated it will be lengthy time for the events to fully unfold. We continue to monitor the impact of these events as we manage our non-Agency RMBS portfolio. |
| |
• | In early third quarter of 2010, President Obama signed into law the Dodd-Frank Wall Street Reform and Consumer Protection Act. This legislation aims to restore responsibility and accountability to the financial system. It remains unclear how this legislation may impact the borrowing environment, investing environment for RMBS and derivatives as much of the Act's implementation has not yet been defined by the regulators and could take several years to be fully implemented. |
| |
• | The Federal Reserve continues to indicate its intention to keep rates low for an extended period as the U.S. economic indicators appear to be in mild recovery with little or no broad inflationary pressures. While we have seen Agency yields decline over the course of 2010, hedging costs have also fallen and funding costs remain extremely low. Most importantly to our 2010 performance, we have seen interest rates decline in the third quarter of 2010 and rise in the fourth quarter of 2010 representing drastically different investing environments. With our attention on managing a low level of duration and interest rate risk, we believe we are positioned to perform in changing interest rate environments. |
The 2011 fiscal year is expected to continue to experience regulatory developments in an effort to stabilize economic conditions and increase liquidity in the financial markets. Most recently, in a February 2011 report released by the Department of Treasury and the Department of Housing and Urban Development, three paths were outlined that reform the GSEs, all of which could drastically change the landscape of the U.S. mortgage market. Again, while the reform could take several years to implement, we do expect that there will be opportunities for a risk-adjusted RMBS investor in 2011 as this develops.
We believe our blended Agency and non-Agency strategies, and our trading expertise, will allow us to navigate the dynamic characteristics of the RMBS environment while these and any future regulatory efforts take shape. Having a diversified portfolio allows us to balance risks, including the volatility and impacts generated by uncertainty in interest rates, changes in prepayments, changes in home prices and homeowner default rates.
Risk-adjusted returns in our Agency RMBS portfolio will decline if we are required to pay higher purchase premiums due to lower interest rates or additional liquidity in the market. Returns are also affected by the possibility of changing interest rates. We expect that the majority of our assets will remain in whole-pool Agency RMBS, due to the long-term attractiveness of the asset class and the need to preserve our exemption under the 1940 Act. Interest-only Agency securities also provide a complementary investment and risk-management strategy to our principal and interest Agency bond investments.
The following table provides the carrying value of our RMBS portfolio by product type:
| | | | | | | | | | | | | |
(dollars in thousands) | December 31,
2010 | | December 31,
2009 |
Agency Bonds | | | | | | | |
Fixed Rate Bonds | $ | 746,957 | | | 55.1 | % | | $ | 112,379 | | | 22.7 | % |
Hybrid ARMs | 269,512 | | | 19.9 | % | | 305,441 | | | 61.8 | % |
Total Agency | 1,016,469 | | | 75.0 | % | | 417,820 | | | 84.5 | % |
Non-Agency Bonds | | | | | | | |
Senior Bonds | 268,161 | | | 19.8 | % | | 54,092 | | | 10.9 | % |
Mezzanine Bonds | 69,775 | | | 5.2 | % | | 22,553 | | | 4.6 | % |
Total Non-Agency | 337,936 | | | 25.0 | % | | 76,645 | | | 15.5 | % |
Total | $ | 1,354,405 | | | | | $ | 494,465 | | | |
Prepayment speeds and volatility due to interest rates
We do not expect housing prices to fully stabilize in 2011 and this, combined with stagnant unemployment rates, housing inventory increases and the potential end of government support, leads us to expect that there will not be a significant increase in prepayment speeds in 2011. Nonetheless, we believe our portfolio approach is well positioned to respond to a variety of market scenarios.
Although we are unable to predict the movement in interest rates for the remainder of 2011 and beyond, our blended Agency and non-Agency portfolio strategy is intended to generate attractive yields with a low level of sensitivity to yield curve, prepayments and interest rate cycles. Our portfolio has a mixture of fixed and hybrid/adjustable rate terms, which we use to manage interest rate risk.
Our Agency bond portfolio is subject to inherent prepayment risk: generally, a decline in interest rates that leads to rising prepayment speeds will cause the market value of our interest-only securities to deteriorate, but will cause the market value of our fixed coupon Agency pools to increase. The inverse relationship occurs when interest rates increase and prepayments slow. We hold a portfolio of Agency securities, which includes bonds with explicit prepayment protection, low loan balances (securities collateralized by loans of less than $150,000 in principal) and seasoned bonds reflecting less prepayment risk due to previously experienced high levels of refinancing. We believe this reduces the prepayment risk to the portfolio.
The following tables provide the carrying value of our Agency bond portfolio by vintage and prepayment protection:
| | | | | | | | | | | | | | |
| As of December 31, 2010 |
(dollars in thousands) | Fixed Rate | | Hybrid ARMs | | Total Agency RMBS |
Pre-pay lock-out or penalty-based | $ | 163,294 | | | $ | 46,447 | | | $ | 209,741 | | | 21 | % |
Low loan balances | 418,978 | | | — | | | 418,978 | | | 41 | % |
Pre-2002 vintages | 102,155 | | | 27,824 | | | 129,979 | | | 13 | % |
2002-2005 vintages | 34,717 | | | 134,913 | | | 169,630 | | | 17 | % |
2006 and subsequent vintages | 27,813 | | | 60,328 | | | 88,141 | | | 8 | % |
Total | $ | 746,957 | | | $ | 269,512 | | | $ | 1,016,469 | | | 100 | % |
| | | | | | | | | | | | | | |
| As of December 31, 2009 |
(dollars in thousands) | Fixed Rate | | Hybrid ARMs | | Total Agency RMBS |
Pre-pay lock-out or penalty-based | $ | 64,005 | | | $ | 47,682 | | | $ | 111,687 | | | 27 | % |
Low loan balances | — | | | — | | | — | | | — | % |
Pre-2002 vintages | 31,344 | | | 32,766 | | | 64,110 | | | 15 | % |
2002-2005 vintages | 12,330 | | | 157,290 | | | 169,620 | | | 41 | % |
2006 and subsequent vintages | 4,700 | | | 67,703 | | | 72,403 | | | 17 | % |
Total | $ | 112,379 | | | $ | 305,441 | | | $ | 417,820 | | | 100 | % |
We are offsetting a portion of the Agency exposure to prepayment speeds through our non-Agency portfolio. Our non-Agency bond yields are expected to increase if prepayment rates on such assets exceed our prepayment assumptions. To the extent that prepayment speeds increase due to macroeconomic factors, we expect to benefit from the ability to recognize the income from the heavily discounted bond prices that principally arose from credit or payment default expectations.
The following tables provide discount information on our non-Agency bond portfolio:
| | | | | | | | | | | |
| As of December 31, 2010 |
(in thousands) | Senior | | Mezzanine | | Total |
Face Value | $ | 447,627 | | | $ | 146,679 | | | $ | 594,306 | |
Unamortized discount | | | | | |
Designated credit reserve | (92,927 | ) | | (52,928 | ) | | (145,855 | ) |
Unamortized net discount | (99,608 | ) | | (30,384 | ) | | (129,992 | ) |
Amortized Cost | $ | 255,092 | | | $ | 63,367 | | | $ | 318,459 | |
| | | | | | | | | | | |
| As of December 31, 2009 |
(in thousands) | Senior | | Mezzanine | | Total |
Face Value | $ | 110,688 | | | $ | 55,893 | | | $ | 166,581 | |
Unamortized discount | | | | | |
Designated credit reserve | (22,710 | ) | | (27,477 | ) | | (50,187 | ) |
Unamortized net discount | (34,420 | ) | | (6,630 | ) | | (41,050 | ) |
Amortized Cost | $ | 53,558 | | | $ | 21,786 | | | $ | 75,344 | |
Credit losses
Although our Agency portfolio is supported by U.S. Government agency and federally chartered corporation guarantees of payment of principal and interest, we are exposed to credit risk in our non-Agency RMBS portfolio. However, the credit support built into RMBS deal structures is designed to provide a level of protection from potential credit losses. In addition, the discounted purchase prices paid on our non-Agency RMBS assets provide additional insulation from credit losses in the event we receive less than 100% of par on such assets. We evaluate credit risk on our non-Agency investments through a comprehensive selection process, which is predominantly focused on quantifying and pricing credit risk. We review our non-Agency RMBS based on quantitative and qualitative analysis of the risk-adjusted returns on such investments. We evaluate each investment's credit risk through our initial modeling and scenario analysis and through on-going asset surveillance. At purchase, we estimate the portion of the discount we do not expect to recover and factor that into our expected yield and accretion methodology. Nevertheless, unanticipated credit losses could occur, adversely impacting our operating results.
Counterparty exposure and leverage ratio
We monitor counterparty exposure in our broker, banking and lending counterparties on a daily basis. Our broker and banking counterparties represent several well capitalized organizations and we attempt to manage our cash balances across these organizations to reduce our exposure to a single counterparty.
In relation to our lending counterparties, we have entered into repurchase agreements with 17 counterparties as of the date of this filing. As of December 31, 2010, we had a debt to equity ratio of 3.1 times which support our hybrid portfolio investment strategy. As of December 31, 2010, we had approximately $6.4 million of unpledged Agency securities and $21.3 million of unpledged non-Agency securities and an overall estimated unused borrowing capacity of approximately $16.6 million. If borrowing rates and collateral requirements change in 2011, we are positioned to adjust to higher interest rates with less earnings volatility than a more levered organization.
Summary of Results of Operations and Financial Condition
Our reported GAAP net income attributable to common stockholders was $16.5 million ($0.60 per diluted share) for the three months ended December 31, 2010 as compared to a GAAP net loss attributable to common stockholders of $6.4 million ($0.38 per diluted share) for the three months ended December 31, 2009. Our reported GAAP net income attributable to common stockholders was $35.8 million ($1.60 per diluted share) for the twelve months ended December 31, 2010 as compared to a GAAP net loss attributable to common stockholders of $8.8 million ($0.39 per
diluted share) for the twelve months ended December 31, 2009. Our results for the period prior to October 28, 2009 represent the historical results of Capitol as a development stage company with no operations.
Our Adjusted GAAP earnings for the three and twelve months ended December 31, 2010 was $11.2 million ($0.41 per diluted share) and $34.3 million ($1.53 per diluted share), respectively. Our GAAP results for the three and twelve months ended December 31, 2010 included changes in unrealized fair value gains and losses, net of tax, of $5.3 and $1.5 million, respectively, on our interest rate swaps and swaptions, utilized to economically hedge interest rate risk associated with these short-term LIBOR-based repurchase agreements and available-for-sale securities for which we have not elected to apply cash flow hedge accounting. As a result, and in order to facilitate comparison to many of our peers, we have included Adjusted GAAP earnings, a non-GAAP measure, which excludes the change in unrealized fair value gains and losses, net of tax, associated with these interest rate swaps and swaptions. A reconciliation between GAAP net income and Adjusted GAAP earnings is provided in the following tables.
On December 8, 2010, we declared a dividend of $0.40 per diluted share. Our GAAP book value per diluted common share was $9.44 at December 31, 2010, an increase from $9.08 book value per diluted common share at December 31, 2009.
The following tables present the components of our net income (loss) for the three and twelve months ended December 31, 2010 and 2009, and the twelve months ended December 31, 2008:
| | | | | | | | | | | | | | | | | | | |
| Three Months Ended | | Year Ended |
(in thousands, except share data) | December 31, | | December 31, |
Income Statement Data: | 2010 | | 2009 | | 2010 | | 2009 | | 2008 |
| | | | | | | | | |
Interest income: | | | | | | | | | | | | | |
Available-for-sale securities | $ | 12,780 | | | $ | 2,796 | | | $ | 39,844 | | | $ | 2,796 | | | $ | — | |
Trading securities | 155 | | | — | | | 170 | | | — | | | — | |
Cash and cash equivalents | 37 | | | 13 | | | 107 | | | 70 | | | 4,443 | |
Total interest income | 12,972 | | | 2,809 | | | 40,121 | | | 2,866 | | | 4,443 | |
Interest expense | 1,644 | | | 131 | | | 4,421 | | | 131 | | | — | |
Net interest income | 11,328 | | | 2,678 | | | 35,700 | | | 2,735 | | | 4,443 | |
Other income: | | | | | | | | | |
Gain on sale of investment securities, net | 1,519 | | | 336 | | | 6,127 | | | 336 | | | — | |
Gain (loss) on interest rate swap and swaption agreements | 3,693 | | | 364 | | | (6,344 | ) | | 364 | | | — | |
Gain on other derivative instruments | 2,959 | | | — | | | 7,156 | | | — | | | — | |
Total other income | 8,171 | | | 700 | | | 6,939 | | | 700 | | | — | |
Expenses: | | | | | | | | | |
Management fees | 921 | | | 326 | | | 2,989 | | | 326 | | | — | |
Other operating expenses | 1,246 | | | 9,425 | | | 4,578 | | | 12,171 | | | 1,060 | |
Total expenses | 2,167 | | | 9,751 | | | 7,567 | | | 12,497 | | | 1,060 | |
Net income (loss) before income taxes | 17,332 | | | (6,373 | ) | | 35,072 | | | (9,062 | ) | | 3,383 | |
Benefit from (provision for) income taxes | (872 | ) | | (48 | ) | | 683 | | | 318 | | | (1,088 | ) |
Net income (loss) | 16,460 | | | (6,421 | ) | | 35,755 | | | (8,744 | ) | | 2,295 | |
Accretion of Trust Account income relating to common stock subject to possible conversion | — | | | — | | | — | | | (93 | ) | | (236 | ) |
Net income (loss) attributable to common stockholders | $ | 16,460 | | | $ | (6,421 | ) | | $ | 35,755 | | | $ | (8,837 | ) | | $ | 2,059 | |
Basic and diluted earnings (loss) per weighted average common share | $ | 0.60 | | | $ | (0.38 | ) | | $ | 1.60 | | | $ | (0.39 | ) | | $ | 0.08 | |
Dividends declared per common share | $ | 0.40 | | | $ | — | | | $ | 1.48 | | | $ | 0.26 | | | $ | — | |
Basic and diluted weighted average number of shares of common stock | 27,532,462 | | | 16,935,316 | | | 22,381,683 | | | 22,941,728 | | | 24,936,558 | |
| | | | | | | | | | | | | | | | | | | | |
(in thousands, except share data) | | Three Months Ended | | Year Ended |
Reconciliation of net income (loss) attributable to common | | December 31, | | December 31, |
stockholders to Adjusted GAAP Earnings | | 2010 | | 2009 | | 2010 | | 2009 | | 2008 |
| | | | | | | | | | |
Net income (loss) attributable to common stockholders | | $ | 16,460 | | | $ | (6,421 | ) | | $ | 35,755 | | | $ | (8,837 | ) | | $ | 2,059 | |
| | | | | | | | | | |
Adjustments to GAAP Net Income: | | | | | | | | | | |
Unrealized gain, net of tax, on interest rate swap and swaptions economically hedging repurchase agreements and available-for-sale securities (1) | | (5,256 | ) | | (240 | ) | | (1,462 | ) | | (240 | ) | | — | |
| | | | | | | | | | |
Adjusted GAAP Earnings | | $ | 11,204 | | | $ | (6,661 | ) | | $ | 34,293 | | | $ | (9,077 | ) | | $ | 2,059 | |
| | | | | | | | | | |
Weighted average shares outstanding - diluted | | 27,532,462 | | | 16,935,316 | | | 22,381,683 | | | 22,941,728 | | | 24,936,558 | |
| | | | | | | | | | |
Adjusted GAAP Earnings per weighted average share outstanding - diluted | | $ | 0.41 | | | NM | | $ | 1.53 | | | NM | | NM |
____________________
| |
(1) | Amounts include tax expense of $1.0 million and tax benefit of $0.5 million for the three and twelve months ended December 31, 2010 and tax expense of $0.1 million for the three and twelve months ended December 31, 2009. |
NM = not meaningful
Results of Operations
The following analysis principally focuses on the results generated in 2010, as our operations did not begin until the completion of the merger transaction with Capitol in late October 2009. Prior to October 28, 2009, Capitol was a development stage company with no operations.
Interest Income and Average Portfolio Yield
For the three months ended December 31, 2010, we recognized $12.7 million of interest income from our Agency and non-Agency RMBS portfolio. Our RMBS portfolio's average amortized cost of securities was approximately $948.4 million for the three months ended December 31, 2010, resulting in an annualized net yield of approximately 5.4%. For the twelve months ended December 31, 2010, we recognized $39.4 million of interest income from our Agency and non-Agency RMBS portfolio. Our RMBS portfolio's average amortized cost of securities was approximately $744.8 million for the twelve months ended December 31, 2010, resulting in an annualized net yield of approximately 5.3%.
For the three months ended December 31, 2010, we recognized $4.7 million of net premium amortization on our Agency RMBS, including our interest-only securities. This resulted in an overall net asset yield of approximately 3.1% on our Agency RMBS. For the three months ended December 31, 2010, we recognized $4.2 million of accretion income from the discounts on our non-Agency portfolio resulting in an overall net yield of approximately 11.4%. For the twelve months ended December 31, 2010, we recognized $13.3 million of net premium amortization on our Agency RMBS, including our interest-only securities. This resulted in an overall net asset yield of approximately 3.4% on our Agency RMBS. For the twelve months ended December 31, 2010, we recognized $10.9 million of accretion income from the discounts on our non-Agency portfolio, resulting in an overall net yield of approximately 10.9%.
For the three months ended December 31, 2009, we recognized $2.8 million of interest income in our Agency and non-Agency RMBS portfolio resulting in an annualized net yield of approximately 6.2% as compared to 5.4% in 2010. The higher yield is due to the timing of the deployment of capital and its favorable impact on annualized yield in the fourth quarter of 2009.
The following tables present the components of the net yield earned by investment type on our RMBS portfolio as a percentage of our average amortized cost of securities:
| | | | | | | | | | | | | | | | | |
| Three Months Ended December 31, 2010 | | Year Ended December 31, 2010 |
| Agency | | Non-Agency | | Consolidated | | Agency | | Non-Agency | | Consolidated |
| (Ratios for the quarter have been annualized) | | | | | | |
Gross Yield/Stated Coupon | 5.8 | % | | 5.0 | % | | 5.6 | % | | 5.8 | % | | 5.1 | % | | 5.6 | % |
Net accretion/amortization of discount/premium | (2.7 | )% | | 6.4 | % | | (0.2 | )% | | (2.4 | )% | | 5.8 | % | | (0.3 | )% |
Net Yield | 3.1 | % | | 11.4 | % | | 5.4 | % | | 3.4 | % | | 10.9 | % | | 5.3 | % |
____________________
| |
(1) | These yields have not been adjusted for cost of delay and cost to carry purchase premiums. |
| | | | | | | | |
| Three Months Ended December 31, 2009 |
| Agency | | Non-Agency | | Consolidated |
| (Ratios for the quarter have been annualized) |
Gross Yield/Stated Coupon | 7.4 | % | | 6.9 | % | | 7.3 | % |
Net accretion/amortization of discount/premium | (3.0 | )% | | 9.3 | % | | (1.1 | )% |
Net Yield | 4.4 | % | | 16.2 | % | | 6.2 | % |
____________________
| |
(1) | These yields have not been adjusted for cost of delay and cost to carry purchase premiums. |
| |
(2) | Prior to October 28, 2009, we were a development stage company without operations, therefore, comparative periods are not applicable. |
The following tables provide the components of interest income and net asset yield detail by investment type on our RMBS portfolio:
| | | | | | | | | | | | | | | | | | |
| Three Months Ended December 31, 2010 |
(dollars in thousands) | Average Amortized Cost | | Coupon Interest | | Net (Premium Amortization)/ Discount Accretion | | Interest Income | | Net Asset Yield |
Agency | $ | 689,614 | | | $ | 9,992 | | | $ | (4,662 | ) | | $ | 5,330 | | | 3.1 | % |
Non-Agency | 258,822 | | | 3,205 | | | 4,195 | | | 7,400 | | | 11.4 | % |
Total | $ | 948,436 | | | $ | 13,197 | | | $ | (467 | ) | | $ | 12,730 | | | 5.4 | % |
| | | | | | | | | | | | | | | | | | |
| Year Ended December 31, 2010 |
(dollars in thousands) | Average Amortized Cost | | Coupon Interest | | Net (Premium Amortization)/ Discount Accretion | | Interest Income | | Net Asset Yield |
Agency | $ | 557,755 | | | $ | 32,368 | | | $ | (13,305 | ) | | $ | 19,063 | | | 3.4 | % |
Non-Agency | 187,091 | | | 9,498 | | | 10,850 | | | 20,348 | | | 10.9 | % |
Total | $ | 744,846 | | | $ | 41,866 | | | $ | (2,455 | ) | | $ | 39,411 | | | 5.3 | % |
| | | | | | | | | | | | | | | | | | |
| Three Months Ended December 31, 2009 |
(dollars in thousands) | Average Amortized Cost | | Coupon Interest | | Net (Premium Amortization)/ Discount Accretion | | Interest Income | | Net Asset Yield |
Agency | $ | 154,562 | | | $ | 2,861 | | | $ | (1,151 | ) | | $ | 1,710 | | | 4.4 | % |
Non-Agency | 26,875 | | | 463 | | | 623 | | | 1,086 | | | 16.2 | % |
Total | $ | 181,437 | | | $ | 3,324 | | | $ | (528 | ) | | $ | 2,796 | | | 6.2 | % |
For the three and twelve months ended December 31, 2010, we also recognized $0.1 and $0.4 million of interest income associated with our AFS U.S. Treasuries, respectively, or approximately 0.9% annualized net yield on average amortized cost, for both respective periods. For the three and twelve months ended December 31, 2010, we recognized $0.2 and $0.2 million of interest income on an average amortized cost basis of $162.5 and $41.0 million, respectively associated with our U.S. Treasuries classified as trading securities. We did not hold any U.S. Treasuries for the three and twelve months ended December 31, 2009.
Interest Expense and the Cost of Funds
For the three months ended December 31, 2010, we recognized $1.5 million in interest expense on our borrowed funds
collateralized by RMBS. For the same three month period, our average outstanding balance under repurchase agreements to fund RMBS was approximately $834.2 million, which was primarily funding our Agency RMBS portfolio. Our leverage ratio on our RMBS portfolio as of December 31, 2010 combined with low LIBOR rates, resulted in an average cost of funds of 0.7% on an annualized basis. For the twelve months ended December 31, 2010, we recognized $4.1 million in interest expense on our borrowed funds collateralized by RMBS. For the same twelve months ended, our average outstanding balance under repurchase agreements to fund RMBS was approximately $641.8 million, resulting in an average cost of funds on our RMBS of 0.6% on an annualized basis.
Interest expense on our borrowed funds increased by $1.4 million for the three months ended December 31, 2010 as compared to the three months ended December 31, 2009. The average outstanding balance under repurchase agreements for that same period increased by $688.2 million in 2010 as compared to 2009 resulting in an increased average cost of funds of 0.3%. This increase was principally due to increased borrowings on our non-Agency RMBS, which carry a higher cost of funding.
For the three and twelve months ended, we also recognized $0.1 and $0.3 million of interest expense, respectively, associated with the financing of our U.S. Treasuries and Agency inverse interest-only derivatives, or an average cost of funds of approximately 0.3% on an annualized basis. The additional funds borrowed resulted in an overall debt-to-equity ratio of 3.1:1.0, largely driven by the borrowings to fund the U.S. Treasuries.
Net Interest Income
For the three months ended December 31, 2010, our net interest income on our RMBS AFS portfolio was $11.2 million resulting in a net interest spread of approximately 4.7%. For the twelve months ended December 31, 2010, our net interest income on our RMBS AFS portfolio was $35.3 million resulting in a net interest spread of approximately 4.7%.
The following tables provide the interest income and expense incurred in the three and twelve months ended December 31, 2010 and three months ended December 31, 2009:
| | | | | | | | | | | | | | | | | | | | | | | |
| Three Months Ended December 31, 2010 | | Year Ended December 31, 2010 |
(dollars in thousands) | Agency | | Non-Agency | | Total | | Agency | | Non-Agency | | Total |
Average available-for-sale | | | | | | | | | | | |
securities held (1) | $ | 689,614 | | | $ | 258,822 | | | $ | 948,436 | | | $ | 557,755 | | | $ | 187,091 | | | $ | 744,846 | |
Total interest income | $ | 5,330 | | | $ | 7,400 | | | $ | 12,730 | | | $ | 19,063 | | | $ | 20,348 | | | $ | 39,411 | |
Yield on average investment securities | 3.1 | % | | 11.4 | % | | 5.4 | % | | 3.4 | % | | 10.9 | % | | 5.3 | % |
Average balance of repurchase | | | | | | | | | | | |
agreements | $ | 668,905 | | | $ | 165,256 | | | $ | 834,161 | | | $ | 540,882 | | | $ | 100,961 | | | $ | 641,843 | |
Total interest expense (2) (3) | $ | 672 | | | $ | 825 | | | $ | 1,497 | | | $ | 2,115 | | | $ | 1,952 | | | $ | 4,067 | |
Average cost of funds | 0.4 | % | | 2.0 | % | | 0.7 | % | | 0.4 | % | | 1.9 | % | | 0.6 | % |
Net interest income | $ | 4,658 | | | $ | 6,575 | | | $ | 11,233 | | | $ | 16,948 | | | $ | 18,396 | | | $ | 35,344 | |
Net interest rate spread | 2.7 | % | | 9.4 | % | | 4.7 | % | | 3.0 | % | | 9.0 | % | | 4.7 | % |
| | | | | | | | | | | |
| Three Months Ended December 31, 2009 |
(dollars in thousands) | Agency | | Non-Agency | | Total |
Average available-for-sale | | | | | |
securities held (1) | $ | 154,562 | | | $ | 26,875 | | | $ | 181,437 | |
Total interest income | $ | 1,710 | | | $ | 1,086 | | | $ | 2,796 | |
Yield on average investment securities | 4.4 | % | | 16.2 | % | | 6.2 | % |
Average balance of repurchase | | | | | |
agreements | $ | 143,678 | | | $ | 2,293 | | | $ | 145,971 | |
Total interest expense (2) (3) | $ | 120 | | | $ | 12 | | | $ | 132 | |
Average cost of funds | 0.3 | % | | 2.0 | % | | 0.4 | % |
Net interest income | $ | 1,590 | | | $ | 1,074 | | | $ | 2,664 | |
Net interest rate spread | 4.1 | % | | 14.2 | % | | 5.8 | % |
____________________
| |
(1) | Excludes change in realized and unrealized gains/(losses). |
| |
(2) | Cost of funds by investment type is based off the underlying investment type of the RMBS AFS assigned as collateral. |
| |
(3) | Cost of funds does not include accrual and settlement of interest associated with interest rate swaps. In accordance with GAAP, those costs are included in gain (loss) on interest rate swap and swaption agreements in the consolidated statement of income (loss). |
Gain on Investment Securities, Net
For the three and twelve months ended December 31, 2010, we sold AFS and trading securities for $167.7 and $474.0 million with an amortized cost of $165.7 and $467.4 million, for a net realized gain of $2.0 and $6.6 million, respectively, which included sales of U.S. Treasuries with an amortized cost of $145.0 and $354.0 million for the three and twelve months ended December 31, 2010. We do not expect to sell assets on a frequent basis, but may sell assets to reallocate capital into new assets that our management believes might have higher risk-adjusted returns.
During the three and twelve months ended December 31, 2010, we recognized unrealized losses on our U.S. Treasury trading securities of $0.5 million. We did not hold any U.S. Treasuries classified as trading securities during the three and twelve months ended December 31, 2009.
The net realized gain on AFS and trading securities increased by $1.7 million for the three months ended December 31, 2010 as compared to the three months ended December 31, 2009. For the three months ended December 31, 2009, we sold AFS and trading securities for $2.5 million with an amortized cost of $2.2 million. There were fewer sales in 2009 since operations commenced in the fourth quarter of 2009.
We review each of our securities on a quarterly basis to determine if an OTTI charge would be necessary. For the three and twelve months ended December 31, 2010 and 2009, we did not recognize any losses from other-than-temporary impairments.
Gain (loss) on Interest Rate Swap and Swaption Agreements
For the three and twelve months ended December 31, 2010, we recognized $1.1 and $3.3 million of expenses for the accrual and/or settlement of the net interest expense associated with the interest rate swaps. The expenses result from paying a fixed interest rate on an average 548.9 million and 336.6 million notional, respectively, to hedge a portion of our interest rate risk on our short-term repurchase agreements and funding costs and receiving LIBOR interest.
During the year ended December 31, 2010, we terminated three notional swap positions of 250.0 million. Upon settlement of the early terminations, we paid $1.3 million in full settlement of our net interest spread liability and $4.4 million in realized losses on the swaps, including any early termination penalty. We elected to terminate the swaps to reduce our cost of financing and align with our investment portfolio.
Also, included in our financial results for the three and twelve months ended December 31, 2010 was the recognition of a $6.8 and $1.4 million, respectively, change in unrealized valuation gains on our interest rate swap and swaption agreements that were accounted as trading instruments. The increase in the two- and three-year swap rates during the three months ended December 31, 2010 resulted in the overall favorable market value movement over the three month period partially offsetting declines in rates during the first three quarters of 2010.
The gains associated with our interest rate swaps and swaptions for the three months ended December 31, 2010 increased by $3.3 million as compared to the three months ended December 31, 2009. This increase is due to additional swaps and swaptions used to hedge our short-term repurchase agreements and their favorable impacts during a period of rising interest rates.
The following table provides the net interest spread and gains and losses associated with our interest rate swap and swaption positions:
| | | | | | | | | | | | | | | |
(in thousands) | Three Months Ended December 31, | | Year Ended December 31, |
| 2010 | | 2009 | | 2010 | | 2009 |
Net interest spread | $ | (1,129 | ) | | $ | — | | | $ | (3,323 | ) | | $ | — | |
Early termination losses | (1,960 | ) | | — | | | (4,446 | ) | | — | |
Change in unrealized gain on interest rate swap and swaption agreements, at fair value | 6,782 | | | 364 | | | 1,425 | | | 364 | |
Gain (loss) on interest rate swap and swaption agreements | $ | 3,693 | | | $ | 364 | | | $ | (6,344 | ) | | $ | 364 | |
Gain on Other Derivative Instruments
Included in our financial results for the three and twelve months ended December 31, 2010 was the recognition of $3.0 and $7.2 million of gains on other derivative instruments we hold for purposes of both hedging and non-hedging activities,
principally TBAs and inverse interest-only securities. Included within these three and twelve months ended December 31, 2010 results, we recognized $1.4 and $3.4 million of interest income, net of accretion, on inverse interest-only securities on an average amortized cost basis of $20.2 and $16.9 million, respectively. The remainder represented realized and unrealized net gains on other derivative instruments. As these derivative instruments are considered trading instruments, the financial results include both realized and unrealized gains (losses) associated with these instruments.
We did not hold other derivative instruments for the three and twelve months ended December 31, 2009.
Expenses
Management Fees
We incurred management fees of $0.9 and $3.0 million for the three and twelve months ended December 31, 2010, which are payable to PRMC Advisers under our management agreement. The management fee is calculated based on our stockholders' equity.
The management fee increased by $0.6 million for the three months ended December 31, 2010 as compared to the three months ended December 31, 2009. The increase is due to increases in stockholders' equity in 2010 as well as 2009 representing only two months of operations.
Other Operating Expenses
For the three months ended December 31, 2010, we recognized $1.2 million of other operating expenses compared to $9.4 million of expenses for the same period in 2009. For the twelve months ended December 31, 2010, we recognized $4.6 million of other operating expenses compared to $12.2 million of other operating expenses for the same period in 2009. The expenses for 2009 primarily represent costs associated with the merger transaction on October 28, 2009 and costs associated with Capitol as a development stage company prior to the merger transaction and are not comparable to the operational costs we incurred in the same three and twelve month period of 2010.
The following table provides other operating expenses as a percentage of average equity for the three and twelve month periods presented:
| | | | | | |
(dollars in thousands) | Other Operating Expenses | | Other Operating Expenses/Average Equity |
| (Ratios for the quarter have been annualized) |
For the Three Months Ended December 31, 2010 | $ | 1,246 | | | 1.9 | % |
For the Three Months Ended September 30, 2010 | $ | 1,213 | | | 2.0 | % |
For the Three Months Ended June 30, 2010 | $ | 1,132 | | | 2.2 | % |
For the Three Months Ended March 31, 2010 | $ | 987 | | | 3.2 | % |
For the Three Months Ended December 31, 2009 | $ | 9,425 | | | 27.3 | % |
For the Year Ended December 31, 2010 | $ | 4,578 | | | 2.2 | % |
For the Year Ended December 31, 2009 (1) | $ | 12,171 | | | 7.1 | % |
____________________
(1) Prior to October 28, 2009, we were a development stage company without operations.
Our other operating expenses as a percentage of average equity for the three months ended December 31, 2010 was 1.9%. The favorable decrease of our operating expense ratio during 2010 resulted from the additional capital raised upon completion of our secondary common stock offerings. See Note 13 of the Notes to the Consolidated Financial Statements.
Income Taxes
For the three and twelve months ended December 31, 2010, we have recognized $0.9 million of income tax expenses and $0.7 million of income tax benefits related to both current and deferred income tax losses in our TRS. Our effective tax rate for the three and twelve months ended December 31, 2010 was an expense of 5.0% and a benefit of 1.9%, respectively.
For the three and twelve months ended December 31, 2010, we have recognized $0.8 million of deferred tax expense and $0.6 million of deferred tax benefit related to unrealized gains and losses on our U.S. Treasuries, interest rate swap and swaption agreements, credit default swaps, short treasuries, and TBAs held in our TRS.
For the three and twelve months ended December 31, 2010, we have recognized current federal tax expense of $0.1 million and current federal tax benefit of $0.1 million due to realized gains and losses on U.S. Treasuries and derivative
instruments.
We currently intend to distribute 100% of our REIT taxable income and comply with all requirements to continue to qualify as a REIT, and therefore we have not recognized any further federal or state tax provisions.
Financial Condition
Available-for-Sale Securities, at Fair Value
Agency RMBS
Our Agency RMBS portfolio is comprised of adjustable rate and fixed rate mortgage-backed securities backed by single-family and multi-family mortgage loans. All of our principal and interest Agency RMBS were Fannie Mae or Freddie Mac mortgage pass-through certificates or collateralized mortgage obligations that carry an implied “AAA” rating, or Ginnie Mae mortgage pass-through certificates, which are backed by the guarantee of the U.S. Government. The majority of these securities consist of whole pools in which we own all of the investment interests in the securities.
The tables below summarize certain characteristics of our Agency available-for-sale securities at December 31, 2010 and December 31, 2009, respectively:
| | | | | | | | | | | | | | | | | | | | | | | | | | | | | | |
| December 31, 2010 |
(dollars in thousands, except purchase price) | Principal/Current Face | | Net (Discount)/ Premium | | Amortized Cost | | Unrealized Gain | | Unrealized Loss | | Carrying Value | | Weighted Average Coupon Rate | | Weighted Average Purchase Price |
| | | | | | | | | | | | | | | |
Principal and interest | | | | | | | | | | | | | | | |
securities: | | | | | | | | | | | | | | | |
Fixed | $ | 683,102 | | | $ | 29,712 | | | $ | 712,814 | | | $ | 6,324 | | | $ | (3,350 | ) | | $ | 715,788 | | | 4.79 | % | | $ | 104.70 | |
Hybrid/ARM | 255,592 | | | 11,939 | | | 267,531 | | | 2,034 | | | (53 | ) | | 269,512 | | | 4.05 | % | | $ | 104.90 | |
Total P&I Securities | 938,694 | | | 41,651 | | | 980,345 | | | 8,358 | | | (3,403 | ) | | 985,300 | | | 4.59 | % | | $ | 104.76 | |
Interest-only securities | | | | | | | | | | | | | | | |
Fixed | 173,653 | | | (153,969 | ) | | 19,684 | | | 786 | | | (2,414 | ) | | 18,056 | | | 5.11 | % | | $ | 13.26 | |
Fixed Other (1) | 194,308 | | | (181,010 | ) | | 13,298 | | | 164 | | | (349 | ) | | 13,113 | | | 1.37 | % | | $ | 7.04 | |
Total | $ | 1,306,655 | | | $ | (293,328 | ) | | $ | 1,013,327 | | | $ | 9,308 | | | $ | (6,166 | ) | | $ | 1,016,469 | | | | | |
| | | | | | | | | | | | | | | | | | | | | | | | | | | | | | |
| December 31, 2009 |
(dollars in thousands, except purchase price) | Principal/Current Face | | Net (Discount)/ Premium | | Amortized Cost | | Unrealized Gain | | Unrealized Loss | | Carrying Value | | Weighted Average Coupon Rate | | Weighted Average Purchase Price |
| | | | | | | | | | | | | | | |
Principal and interest | | | | | | | | | | | | | | | |
securities: | | | | | | | | | | | | | | | |
Fixed | $ | 93,761 | | | $ | 4,259 | | | $ | 98,020 | | | $ | — | | | $ | (1,691 | ) | | $ | 96,329 | | | 5.23 | % | | $ | 104.62 | |
Hybrid/ARM | 292,332 | | | 14,277 | | | 306,609 | | | 120 | | | (1,287 | ) | | 305,442 | | | 4.37 | % | | $ | 104.92 | |
Total P&I Securities | 386,093 | | | 18,536 | | | 404,629 | | | 120 | | | (2,978 | ) | | 401,771 | | | 4.58 | % | | $ | 104.85 | |
Interest-only securities | | | | | | | | | | | | | | | |
Fixed | 148,786 | | | (133,344 | ) | | 15,442 | | | 962 | | | (355 | ) | | 16,049 | | | 5.51 | % | | $ | 10.76 | |
Fixed Other (1) | — | | | — | | | — | | | — | | | — | | | — | | | — | % | | $ | — | |
Total | $ | 534,879 | | | $ | (114,808 | ) | | $ | 420,071 | | | $ | 1,082 | | | $ | (3,333 | ) | | $ | 417,820 | | | | | |
____________________
(1) Fixed Other represent weighted-average coupon interest-only securities that are not generally used for our interest-rate risk management purposes. These securities pay variable coupon interest based on the weighted average of the fixed rates of the underlying loans of the security, less the weighted average rates of the applicable issued principal and interest securities.
Our three-month average constant prepayment rate, or CPR, experienced by Agency RMBS owned by us as of December 31, 2010, on an annualized basis, was 8.0%.
The following table summarizes the number of months until the next re-set for our floating or adjustable rate Agency RMBS mortgage portfolio at December 31, 2010 and December 31, 2009, respectively:
| | | | | | |
(in thousands) | Carrying Value |
| December 31, 2010 | December 31, 2009 |
0-12 months | $ | 213,050 | | $ | 116,668 | |
13-36 months | 21,081 | | 147,814 | |
37-60 months | 6,296 | | 5,539 | |
Greater than 60 months | 29,085 | | 35,420 | |
Total | $ | 269,512 | | $ | 305,441 | |
Non-Agency RMBS
Our non-Agency RMBS portfolio is comprised of senior and mezzanine tranches of mortgage-backed securities. The following tables provide investment information on our non-Agency RMBS as of December 31, 2010 and December 31, 2009, respectively:
| | | | | | | | | | | | | | | | | | | | | | | | | | | |
| As of December 31, 2010 |
(in thousands) | Principal/Current Face | | Accretable Purchase Discount | | Credit Reserve Purchase Discount | | Amortized Cost | | Unrealized Gain | | Unrealized Loss | | Carrying Value |
Senior | $ | 447,627 | | | $ | (99,608 | ) | | $ | (92,927 | ) | | $ | 255,092 | | | $ | 13,977 | | | $ | (908 | ) | | $ | 268,161 | |
Mezzanine | 146,679 | | | (30,384 | ) | | (52,928 | ) | | 63,367 | | | 7,526 | | | (1,118 | ) | | 69,775 | |
Total | $ | 594,306 | | | $ | (129,992 | ) | | $ | (145,855 | ) | | $ | 318,459 | | | $ | 21,503 | | | $ | (2,026 | ) | | $ | 337,936 | |
| | | | | | | | | | | | | | | | | | | | | | | | | | | |
| As of December 31, 2009 |
(in thousands) | Principal/Current Face | | Accretable Purchase Discount | | Credit Reserve Purchase Discount | | Amortized Cost | | Unrealized Gain | | Unrealized Loss | | Carrying Value |
Senior | $ | 110,688 | | | $ | (34,420 | ) | | $ | (22,710 | ) | | $ | 53,558 | | | $ | 1,007 | | | $ | (473 | ) | | $ | 54,092 | |
Mezzanine | 55,893 | | | (6,630 | ) | | (27,477 | ) | | 21,786 | | | 1,013 | | | (246 | ) | | 22,553 | |
Total | $ | 166,581 | | | $ | (41,050 | ) | | $ | (50,187 | ) | | $ | 75,344 | | | $ | 2,020 | | | $ | (719 | ) | | $ | 76,645 | |
The following tables present certain information detailed by investment type and their respective underlying loan characteristics for our senior and mezzanine non-Agency RMBS, excluding our non-Agency interest-only portfolio, at December 31, 2010 and December 31, 2009, respectively:
| | | | | | | | | | | |
| At December 31, 2010 |
Non-Agency Principal and Interest (P&I) RMBS Characteristics | Senior Bonds | | Mezzanine Bonds | | Total P&I Bonds |
Carrying Value (in thousands) | $ | 267,775 | | | $ | 69,775 | | | $ | 337,550 | |
% of Non-Agency Portfolio | 79.3 | % | | 20.7 | % | | 100.0 | % |
Average Price | $ | 62.30 | | | $ | 52.39 | | | $ | 60.25 | |
Average Coupon | 3.0 | % | | 1.9 | % | | 2.7 | % |
Average Fixed Coupon | 5.7 | % | | 5.9 | % | | 5.7 | % |
Average Floating Coupon | 1.8 | % | | 0.9 | % | | 1.6 | % |
Average Hybrid Coupon | 4.4 | % | | 5.5 | % | | 4.6 | % |
Collateral Attributes | | | | | |
Avg Loan Age (months) | 58 | | | 69 | | | 60 | |
Avg Original Loan-to-Value | 77 | % | | 76 | % | | 77 | % |
Avg Original FICO (1) | 680 | | | 673 | | | 679 | |
Current Performance | | | | | |
60+ day delinquencies | 34 | % | | 26 | % | | 33 | % |
Average Credit Enhancement (2) | 24 | % | | 22 | % | | 24 | % |
3-Month CPR (3) | 3.9 | % | | 4.1 | % | | 3.9 | % |
| | | | | | | | | | | |
| At December 31, 2009 |
Non-Agency Principal and Interest (P&I) RMBS Characteristics | Senior Bonds | | Mezzanine Bonds | | Total P&I Bonds |
Carrying Value (in thousands) | $ | 53,646 | | | $ | 22,553 | | | $ | 76,199 | |
% of Non-Agency Portfolio | 70.4 | % | | 29.6 | % | | 100.0 | % |
Average Price | $ | 55.19 | | | $ | 40.35 | | | $ | 49.77 | |
Average Coupon | 3.6 | % | | 2.8 | % | | 3.3 | % |
Average Fixed Coupon | 5.6 | % | | 5.8 | % | | 5.6 | % |
Average Floating Coupon | 1.0 | % | | 1.0 | % | | 1.0 | % |
Average Hybrid Coupon | 5.5 | % | | 5.6 | % | | 5.6 | % |
Collateral Attributes | | | | | |
Avg Loan Age (months) | 50 | | | 57 | | | 52 | |
Avg Original Loan-to-Value | 75 | % | | 70 | % | | 73 | % |
Avg Original FICO (1) | 689 | | | 722 | | | 699 | |
Current Performance | | | | | |
60+ day delinquencies | 26 | % | | 16 | % | | 23 | % |
Average Credit Enhancement (2) | 13.1 | % | | 11.7 | % | | 12.7 | % |
3-Month CPR (3) | 13.9 | % | | 18.0 | % | | 15.1 | % |
____________________
| |
(1) | FICO represents a mortgage industry accepted credit score of a borrower, which was developed by Fair Isaac Corporation. |
| |
(2) | Average credit enhancement remaining on our non-Agency RMBS portfolio, which is the average amount of protection available to absorb future credit losses due to defaults on the underlying collateral. |
| |
(3) | 3-Month CPR is reflective of the prepayment speed on the underlying securitization; however, it does not necessarily indicate the proceeds received on our investment tranche. Proceeds received for each security are dependent on the position of the individual security within the structure of each deal. |
| | | | | | | | | | | | | | | | | | | | |
Non-Agency RMBS Characteristics | December 31, 2010 |
(dollars in thousands) | Senior Bonds | | Mezzanine Bonds | | Total Bonds |
Loan Type | Carrying Value | | % of Senior Bonds | | Carrying Value | | % of Mezzanine Bonds | | Carrying Value | | % of Non-Agency Portfolio |
Prime | $ | 9,927 | | | 3.7 | % | | $ | 3,011 | | | 4.3 | % | | $ | 12,938 | | | 3.9 | % |
Alt-A | 53,942 | | | 20.1 | % | | 10,297 | | | 14.8 | % | | 64,239 | | | 19.0 | % |
POA | 107,125 | | | 40.0 | % | | 22,525 | | | 32.3 | % | | 129,650 | | | 38.4 | % |
Subprime | 96,781 | | | 36.2 | % | | 33,942 | | | 48.6 | % | | 130,723 | | | 38.7 | % |
| $ | 267,775 | | | 100.0 | % | | $ | 69,775 | | | 100.0 | % | | $ | 337,550 | | | 100.0 | % |
| | | | | | | | | | | | | | | | | | | | |
Non-Agency RMBS Characteristics | December 31, 2009 |
(dollars in thousands) | Senior Bonds | | Mezzanine Bonds | | Total Bonds |
Loan Type | Carrying Value | | % of Senior Bonds | | Carrying Value | | % of Mezzanine Bonds | | Carrying Value | | % of Non-Agency Portfolio |
Prime | $ | 8,607 | | | 16.0 | % | | $ | 10,248 | | | 45.4 | % | | $ | 18,855 | | | 24.7 | % |
Alt-A | 28,154 | | | 52.5 | % | | 6,123 | | | 27.2 | % | | 34,277 | | | 45.0 | % |
POA | 4,838 | | | 9.0 | % | | 6,182 | | | 27.4 | % | | 11,020 | | | 14.5 | % |
Subprime | 12,047 | | | 22.5 | % | | — | | | — | % | | 12,047 | | | 15.8 | % |
| $ | 53,646 | | | 100.0 | % | | $ | 22,553 | | | 100.0 | % | | $ | 76,199 | | | 100.0 | % |
| | | | | | | | | | | | | | | | | | | | |
Non-Agency RMBS Characteristics | December 31, 2010 |
(dollars in thousands) | Senior Bonds | | Mezzanine Bonds | | Total Bonds |
Coupon Type | Carrying Value | | % of Senior Bonds | | Carrying Value | | % of Mezzanine Bonds | | Carrying Value | | % of Non-Agency Portfolio |
Fixed Rate | $ | 79,181 | | | 29.6 | % | | $ | 13,238 | | | 19.0 | % | | $ | 92,419 | | | 27.4 | % |
Hybrid or Floating | 188,594 | | | 70.4 | % | | 56,537 | | | 81.0 | % | | 245,131 | | | 72.6 | % |
| $ | 267,775 | | | 100.0 | % | | $ | 69,775 | | | 100.0 | % | | $ | 337,550 | | | 100.0 | % |
| | | | | | | | | | | | | | | | | | | | |
Non-Agency RMBS Characteristics | December 31, 2009 |
(dollars in thousands) | Senior Bonds | | Mezzanine Bonds | | Total Bonds |
Coupon Type | Carrying Value | | % of Senior Bonds | | Carrying Value | | % of Mezzanine Bonds | | Carrying Value | | % of Non-Agency Portfolio |
Fixed Rate | $ | 33,494 | | | 62.4 | % | | $ | 7,857 | | | 34.8 | % | | $ | 41,351 | | | 54.3 | % |
Hybrid or Floating | 20,152 | | | 37.6 | % | | 14,696 | | | 65.2 | % | | 34,848 | | | 45.7 | % |
| $ | 53,646 | | | 100.0 | % | | $ | 22,553 | | | 100.0 | % | | $ | 76,199 | | | 100.0 | % |
| | | | | | | | | | | | | | | | | | | | |
Non-Agency RMBS Characteristics | December 31, 2010 |
(dollars in thousands) | Senior Bonds | | Mezzanine Bonds | | Total Bonds |
Loan Origination Year | Carrying Value | | % of Senior Bonds | | Carrying Value | | % of Mezzanine Bonds | | Carrying Value | | % of Non-Agency Portfolio |
2006+ | $ | 162,385 | | | 60.6 | % | | $ | 17,550 | | | 25.2 | % | | $ | 179,935 | | | 53.3 | % |
2002-2005 | 104,284 | | | 39.0 | % | | 51,852 | | | 74.3 | % | | 156,136 | | | 46.3 | % |
Pre-2002 | 1,106 | | | 0.4 | % | | 373 | | | 0.5 | % | | 1,479 | | | 0.4 | % |
| $ | 267,775 | | | 100.0 | % | | $ | 69,775 | | | 100.0 | % | | $ | 337,550 | | | 100.0 | % |
| | | | | | | | | | | | | | | | | | | | |
Non-Agency RMBS Characteristics | December 31, 2009 |
(dollars in thousands) | Senior Bonds | | Mezzanine Bonds | | Total Bonds |
Loan Origination Year | Carrying Value | | % of Senior Bonds | | Carrying Value | | % of Mezzanine Bonds | | Carrying Value | | % of Non-Agency Portfolio |
2006+ | $ | 24,020 | | | 44.8 | % | | $ | 5,087 | | | 22.6 | % | | $ | 29,107 | | | 38.2 | % |
2002-2005 | 29,048 | | | 54.1 | % | | 17,262 | | | 76.5 | % | | 46,310 | | | 60.8 | % |
Pre-2002 | 578 | | | 1.1 | % | | 204 | | | 0.9 | % | | 782 | | | 1.0 | % |
| $ | 53,646 | | | 100.0 | % | | $ | 22,553 | | | 100.0 | % | | $ | 76,199 | | | 100.0 | % |
The underlying mortgage loans collateralizing our non-Agency RMBS are located across the United States. The following table presents the five largest geographic concentrations of the mortgages collateralizing these RMBS at December 31, 2010 and December 31, 2009, respectively:
| | | | | | | | | | | | | |
| December 31, 2010 | | December 31, 2009 |
(dollars in thousands) | Carrying Value | | % of non-Agency RMBS | | Carrying Value | | % of non-Agency RMBS |
California | $ | 123,611 | | | 36.6 | % | | $ | 28,861 | | | 37.7 | % |
Florida | 35,198 | | | 10.4 | % | | 7,589 | | | 9.9 | % |
Puerto Rico | 16,175 | | | 4.8 | % | | 428 | | | 0.6 | % |
New York | 13,990 | | | 4.1 | % | | 4,007 | | | 5.2 | % |
Arizona | 9,682 | | | 2.9 | % | | 2,556 | | | 3.3 | % |
| $ | 198,656 | | | 58.8 | % | | $ | 43,441 | | | 56.7 | % |
Repurchase Agreements
Our borrowings consist entirely of repurchase agreements collateralized by our pledge of AFS and trading securities, derivative instruments and certain cash balances. Substantially all of our Agency RMBS are currently pledged as collateral, however, only a portion of our non-Agency RMBS has been pledged. As of December 31, 2010, our debt-to-equity ratio was 3.1:1.0. Our debt-to-equity ratio includes the debt collateralized by our U.S. Treasuries and Agency derivatives. Our debt-to-equity ratio for RMBS and Agency derivatives only was 2.5:1.0. In 2010, our debt-to-equity ratio ranged between 3.0 and 4.0 times depending on Agency and Non-Agency allocations. The lower ratio as of December 31, 2010 was due to the timing of the December capital raise and pending settlement of open positions in January 2011. We believe our debt-to-equity ratio provides unused borrowing capacity and, thus, improves our liquidity and the strength of our balance sheet.
As of December 31, 2010, the term to maturity of our borrowings ranged from four days to over seven months. The weighted average original term to maturity of our borrowings collateralized by RMBS was 90 days at December 31, 2010. At December 31, 2010, the weighted average cost of funds for all our repurchase agreements was 0.66%.
| | | | | | | | | | | | | | |
(dollars in thousands) | | December 31, 2010 | | December 31, 2009 |
Collateral Type | | Amount Outstanding | | Weighted Average | | Amount Outstanding | | Weighted Average |
U.S. treasuries | | $ | 198,750 | | | 0.28 | % | | $ | — | | | — | |
Agency RMBS | | 745,861 | | | 0.37 | % | | 395,642 | | | 0.37 | % |
Non-Agency RMBS | | 201,976 | | | 2.05 | % | | 16,251 | | | 1.94 | % |
Agency derivatives | | 23,216 | | | 1.07 | % | | — | | | — | |
Total | | $ | 1,169,803 | | | 0.66 | % | | $ | 411,893 | | | 0.43 | % |
As of December 31, 2010, our amounts outstanding under repurchase agreements includes $70.8 million of borrowings under the 364-day repurchase facility with Wells Fargo. The facility provides an aggregate maximum borrowing capacity of $75 million and it is set to mature on August 3, 2011, unless extended pursuant to its terms. The facility is collateralized by non-Agency RMBS and its weighted average borrowing rate as of December 31, 2010 was 1.98%.
Equity
As of December 31, 2010, our stockholders' equity was $382.4 million and our diluted book value per share was $9.44.
As of December 31, 2009, our stockholders' equity was $121.7 million and our diluted book value per share was $9.08.
The following table provides details of our changes in stockholders' equity from December 31, 2009 to December 31, 2010:
| | | | | | | | |
(dollars in thousands, except per share amounts) | | Book Value | | Book Value Per Diluted Share (2) |
Stockholders' equity at December 31, 2009 | | $ | 121,721 | | | $ | 9.08 | |
GAAP net income: | | | | |
Core Earnings, net of tax of $0.2 million (1) | | 29,169 | | | 0.72 | |
Realized gains and losses, net of tax | | 4,176 | | | 0.10 | |
Unrealized mark-to-market gains and losses, net of tax | | 2,410 | | | 0.06 | |
Other comprehensive income, net of tax | | 23,569 | | | 0.58 | |
Dividend declaration | | (34,086 | ) | | (0.84 | ) |
Net proceeds from common stock issuance | | 235,275 | | | (0.27 | ) |
Other | | 214 | | | 0.01 | |
Stockholders' equity at December 31, 2010 | | $ | 382,448 | | | $ | 9.44 | |
____________________
| |
(1) | Core Earnings is a non-GAAP measure that we define as net income, excluding impairment losses, gains or losses on sales of securities and termination of interest rate swaps, unrealized gains or losses on trading securities, interest rate swaps and swaptions, certain gains or losses on other derivative instruments and non-recurring business combination expenses. As defined, Core Earnings includes interest income associated with our inverse interest-only securities ("Agency derivatives") and premium income on credit default swaps. Core Earnings is provided for purposes of comparability to other peer issuers. |
| |
(2) | Diluted shares outstanding at end of period are used as the denominator in book value per share calculation. |
The following table provides details of our changes in stockholders' equity from the date of the merger transaction completed on October 28, 2009 through December 31, 2009:
| | | | | | | | |
(dollars in thousands, except per share amounts) | | Book Value | | Book Value Per Diluted Share (2) |
Stockholders' equity at merger completion | | $ | 124,634 | | | $ | 9.30 | |
Post-merger activities | | | | |
GAAP net income, net of tax | | 1,676 | | | 0.13 | |
Other comprehensive income | | (950 | ) | | (0.07 | ) |
Dividend declaration | | (3,484 | ) | | (0.26 | ) |
Other | | (155 | ) | | (0.02 | ) |
Stockholders' equity at December 31, 2009 | | $ | 121,721 | | | $ | 9.08 | |
GAAP to Taxable Income
The following table provides reconciliation of our GAAP loss to our taxable income (loss) split between our REIT and taxable REIT subsidiary for the year ended December 31, 2010 and December 31, 2009, respectively:
| | | | | | | | | | | | | | | | | | | | | | | |
| Year Ended December 31, 2010 | | Year Ended December 31, 2009 |
(dollars in millions) | TRS | | REIT | | Consolidated | | TRS | | REIT | | Consolidated |
GAAP net income (loss), pre-tax | $ | (2.0 | ) | | $ | 37.1 | | | $ | 35.1 | | | $ | (7.2 | ) | | $ | (1.9 | ) | | $ | (9.1 | ) |
Permanent differences | | | | | — | | | | | | | — | |
Capitol dividend of E&P | — | | | — | | | — | | | — | | | 1.0 | | | 1.0 | |
Non-deductible expenses | — | | | 0.2 | | | 0.2 | | | 6.3 | | | 3.3 | | | 9.6 | |
Temporary differences | | | | | — | | | | | | | — | |
Net accretion of OID and market discount | — | | | 3.1 | | | 3.1 | | | — | | | 1.2 | | | 1.2 | |
Unrealized gain (loss) on trading securities and derivatives | 2.1 | | | (3.8 | ) | | (1.7 | ) | | (0.4 | ) | | — | | | (0.4 | ) |
Taxable income (loss) | 0.1 | | | 36.6 | | | 36.7 | | | (1.3 | ) | | 3.6 | | | 2.3 | |
Dividend declaration deduction | — | | | (34.1 | ) | | (34.1 | ) | | — | | | (3.5 | ) | | (3.5 | ) |
Taxable income (loss) post-dividend deduction | $ | 0.1 | | | $ | 2.5 | | | $ | 2.6 | | | $ | (1.3 | ) | | $ | 0.1 | | | $ | (1.2 | ) |
The permanent tax differences are non-recurring permanent tax differences that were recorded in 2010. These items will not impact future dividend declarations and/or book value in 2011 and beyond. Temporary differences are principally timing differences between GAAP and tax accounting, which will adjust over the course of the RMBS's term and/or at time of sale of the RMBS in the future.
Change in Accumulated Other Comprehensive Income
With our accounting treatment for available-for-sale securities, unrealized fluctuations in the market values of securities do not impact our GAAP or taxable income but are recognized on our balance sheet as a change in stockholder's equity under “accumulated other comprehensive income/(loss).” As a result of this fair value accounting through stockholder's equity, we expect our net income to have less significant fluctuations and result in less GAAP to taxable income timing differences, than if the portfolio were accounted as trading instruments.
Dividends
For the 2010 taxable year, we declared dividends to common stockholders totaling $34.1 million, or $1.48 per share. As a REIT, we are required to distribute 90% of our taxable income to stockholders, subject to certain distribution requirements. Our board of directors for the fiscal year ended 2010 has elected to distribute the majority of our taxable income to avoid U.S. Federal Income taxes. As such, temporary differences between GAAP and taxable income can generate deterioration in book value on a permanent and temporary basis as taxable income is distributed that has not been earned for GAAP purposes. The following table presents cash dividends declared on our common stock from October 28, 2009 through December 31, 2010:
| | | | | | | | |
Declaration Date | | Record Date | | Payment Date | | Cash Dividend Per Share |
December 8, 2010 | | December 17, 2010 | | January 20, 2011 | | $ | 0.40 | |
September 13, 2010 | | September 30, 2010 | | October 21, 2010 | | $ | 0.39 | |
June 14, 2010 | | June 30, 2010 | | July 22, 2010 | | $ | 0.33 | |
March 12, 2010 | | March 31, 2010 | | April 23, 2010 | | $ | 0.36 | |
December 21, 2009 | | December 31, 2009 | | January 26, 2010 | | $ | 0.26 | |
Liquidity and Capital Resources
Our liquidity and capital resources are managed and forecast on a daily basis to ensure that we have sufficient liquidity to absorb market events that could negatively impact collateral valuations and result in margin calls and to ensure that we have the flexibility to manage our portfolio to take advantage of market opportunities.
Our principal sources of cash consist of borrowings under repurchase agreements, payments of principal and interest we receive on our RMBS portfolio, cash generated from our operating results, and proceeds from capital market transactions. We typically use cash to repay principal and interest on our repurchase agreements, to purchase RMBS, to make dividend payments on our capital stock, and to fund our operations.
To the extent that we raise additional equity capital through capital market transactions, we anticipate using cash proceeds from such transactions to purchase additional RMBS and for other general corporate purposes. There can be no assurance, however, that we will be able to raise additional equity capital at any particular time or on any particular terms.
As of December 31, 2010, we held $163.9 million in cash and cash equivalents and $12.3 million in due from counterparties available to support our operations, $1.4 billion of AFS and derivative assets held at fair value, and $1.2 billion of outstanding debt in the form of repurchase agreements. As of December 31, 2010, our debt-to-equity ratio was 3.1:1.0. During the three months ended December 31, 2010, our debt-to-equity ratio decreased from 3.9:1.0 to 3.1:1.0, including monies borrowed to finance our investment in U.S. Treasuries. The debt-to-equity ratio funding our RMBS and Agency derivatives decreased from 3.3:1:0 to 2.5:1.0 as we completed the investment of our offering proceeds in early January 2011. We believe the debt-to-equity ratio funding our RMBS and Agency derivatives is the most meaningful leverage measure as U.S. Treasuries are viewed to be highly liquid in nature.
As of December 31, 2010, we had approximately $6.4 million of unpledged Agency securities and $21.3 million of unpledged non-Agency securities and an overall estimated unused borrowing capacity of approximately $16.6 million. On a daily basis, we monitor and forecast our available, or excess, liquidity. Additionally, we frequently perform shock analyses against various market events to monitor the adequacy of our excess liquidity. If borrowing rates and collateral requirements change in 2010, we believe we are positioned to adjust to higher interest rates with less earnings volatility than a more leveraged organization.
We have not experienced any restrictions to our funding sources in 2010 and generally witnessed an increasing amount of available liquidity in the RMBS marketplace. We expect ongoing sources of financing to be primarily repurchase agreements and similar financing arrangements. We plan to finance our assets with a moderate amount of leverage, the level of which may vary based upon the particular characteristics of our portfolio and market conditions. We may deploy, on a debt-to-equity basis, up to ten times leverage on our Agency RMBS assets. We also deploy some leverage on our non-Agency RMBS assets utilizing repurchase agreements as the source of financing.
We have master repurchase agreements in place with sixteen counterparties and continue to evaluate further counterparties to manage and reduce counterparty risk. Under our repurchase agreements, we are required to pledge additional assets as collateral to our counterparties (lenders) when the estimated fair value of the existing pledged collateral under such agreements declines and such lenders, through a margin call, demand additional collateral. Lenders generally make margin calls because of a perceived decline in the value of our assets collateralizing the repurchase agreements. This may occur following the monthly principal reduction of assets due to scheduled amortization and prepayments on the underlying mortgages, or may be caused by changes in market interest rates, a perceived decline in the market value of the investments and other market factors. To cover a margin call, we may pledge additional securities or cash. At maturity, any cash on deposit as collateral is generally applied against the repurchase agreement balance, thereby reducing the amount borrowed. Should the value of our assets suddenly decrease, significant margin calls on our repurchase agreements could result, causing an adverse change in our liquidity position.
On August 4, 2010, we entered into a repurchase agreement with Wells Fargo Bank, National Association, or Wells Fargo. The repurchase agreement will serve as a repurchase facility to be used from time to time to finance certain of our non-Agency securities held in our RMBS portfolio with Wells Fargo pursuant to its terms. The Wells Fargo repurchase agreement provides for a 364-day term with an aggregate maximum borrowing capacity of $75 million and it is set to mature on August 3, 2011, unless extended pursuant to its terms.
Once an RMBS is financed by Wells Fargo in accordance with the repurchase agreement, the financing is committed for the duration of the facility subject to similar pledged collateral and margin requirements as a standard repurchase agreement discussed above. As part of the repurchase agreement, we are subject to certain financial covenants, in which we monitor and comply with on a daily basis. The extended duration of the facility and its terms provide an additional source to manage our liquidity and interest rate risk.
We have guaranteed the obligations of our subsidiary, Two Harbors Asset I, under the Wells Fargo Repurchase Agreements. As a result, we are subject to the following financial covenants, as further detailed by the Guaranty Agreement:
| |
(a) | On any date, the ratio of our Total Indebtedness to our Tangible Net Worth, on a consolidated basis, shall not be greater than 6.00 to 1.00. As of December 31, 2010, our calculated ratio, as defined, was 3.1 to 1.00. |
| |
(b) | On any date, the Guarantor's Liquidity, on a consolidated basis, shall not be less than $15,000,000. As of December 31, 2010, our liquidity, as defined, was $27.1 million. |
| |
(c) | On any date, the Guarantor's Tangible Net Worth, on a consolidated basis, shall not be less than $150,000,000. As of December 31, 2010, our tangible net worth, as defined, was $382.4 million. |
Our parent company serves as guarantor for a number of additional ISDA and repurchase agreements entered into by our subsidiaries in the normal course of business. The covenants noted above are considered the most restrictive of all covenant terms under these agreements. We intend to continue to operate in a manner which complies with all guarantor requirements.
The following table summarizes assets at carrying value that are pledged or restricted as collateral for the future payment obligations of repurchase agreements.
| | | | | | | |
(in thousands) | December 31,
2010 | | December 31,
2009 |
Available-for-sale securities, at fair value | $ | 1,090,598 | | | $ | 444,833 | |
Trading securities, at fair value | 199,523 | | | — | |
Cash and cash equivalents | 14,467 | | | — | |
Restricted cash | 11,634 | | | 913 | |
Due from counterparties | 10,508 | | | 1,737 | |
Derivative assets, at fair value | 30,534 | | | — | |
Total | $ | 1,357,264 | | | $ | 447,483 | |
Although we generally intend to hold our target assets as long-term investments, we may sell certain of our investment securities in order to manage our interest rate risk and liquidity needs, to meet other operating objectives and to adapt to market conditions. We cannot predict the timing and impact of future sales of investment securities, if any. Because many of our investment securities are financed with repurchase agreements and may be financed with credit facilities (including term loans and revolving facilities), a significant portion of the proceeds from sales of our investment securities (if any), prepayments and scheduled amortization are used to repay balances under these financing sources.
The following table provides the maturities of our repurchase agreements as of December 31, 2010 and December 31, 2009:
| | | | | | | |
(in thousands) | December 31,
2010 | | December 31,
2009 |
Within 30 days | $ | 197,286 | | | $ | 207,050 | |
30 to 59 days | 211,556 | | | — | |
60 to 89 days | 117,621 | | | — | |
90 to 119 days | 152,433 | | | — | |
Over 120 days (1) | 292,157 | | | 204,842 | |
Open maturity (2) | 198,750 | | | — | |
Total | $ | 1,169,803 | | | $ | 411,892 | |
____________________
| |
(1) | Over 120 days includes the amounts outstanding under the Wells Fargo 364-day borrowing facility. |
| |
(2) | Repurchase agreements collateralized by U.S. Treasuries include an open maturity period (i.e., rolling 1-day maturity) renewable at the discretion of either party to the agreements. |
For the year ended December 31, 2010, our unrestricted cash balance increased from $26.1 million to $163.9 million. The cash movements can be summarized by the following:
| |
• | Cash flows from operating activities. For the year ended December 31, 2010, operating activities increased our cash balances by approximately $33.1 million, primarily driven by our strong interest yield and financial results for the year. |
| |
• | Cash flows from investing activities. For the year ended December 31, 2010, investing activities reduced our cash balances by approximately $861.4 million. The reduction was driven by the increase in our RMBS portfolio as we deployed capital from our common stock offerings. Included in this change is an increase in due to counterparties represented by 2011 RMBS settlements. |
| |
• | Cash flows from financing activities. For the year ended December 31, 2010, financing activities increased our cash balance by approximately $966.1 million, resulting from the net borrowings under repurchase agreements to fund our AFS portfolio as well as net proceeds of $235.3 million obtained from our common stock offerings. |
Off-Balance Sheet Arrangements
We have no obligations, assets or liabilities which would be considered off-balance sheet arrangements. We have not participated in transactions that create relationships with unconsolidated entities or financial partnerships, often referred to as variable interest entities, which would have been established for the purpose of facilitating off-balance sheet arrangements.
Aggregate Contractual Obligations
As of December 31, 2010, we do not have any long-term debt, capital lease obligations, operating lease obligations or long-term liabilities.
We have established a number of master repurchase agreements with counterparties and we expect to execute additional master repurchase agreements. These repurchase agreements are short-term with maturities of less than one year.
We have entered into a management agreement with PRCM Advisers, pursuant to which PRCM Advisers is entitled to receive a management fee and the reimbursement of certain expenses from us. We reimburse PRCM Advisers for (i) our allocable share of the compensation paid by PRCM Advisers to its personnel serving as our principal financial officer and general counsel and personnel employed by PRCM Advisers as in-house legal, tax, accounting, consulting, auditing, administrative, information technology, valuation, computer programming and development and back-office resources to us, and (ii) any amounts for personnel of PRCM Advisers' affiliates arising under a shared facilities and services agreement.
We are party to contracts that contain a variety of indemnification obligations, principally with brokers, underwriters and counterparties to repurchase agreements. The maximum potential future payment amount we could be required to pay under these indemnification obligations may be unlimited.
Recently Issued Accounting Standards
Refer to Note 2 of the Notes to the Consolidated Financial Statements included in Item 8 of this Form 10-K.
Inflation
Substantially all of our assets and liabilities are financial in nature. As a result, changes in interest rates and other factors impact our performance far more than does inflation. Our financial statements are prepared in accordance with GAAP and dividends are based upon net ordinary income and capital gains as calculated for tax purposes; in each case, our results of operations and reported assets, liabilities and equity are measured with reference to historical cost or fair value without considering inflation.
Other Matters
We intend to conduct our business so as to maintain our exempt status under, and not to become regulated as an investment company for purposes of the 1940 Act. If we failed to maintain our exempt status under the 1940 Act and became regulated as an investment company, our ability to, among other things, use leverage would be substantially reduced and, as a result, we would be unable to conduct our business as described in Item 1 - Business - Other Business - Regulation of this Form 10-K. Accordingly, we monitor our compliance with both the 55% Test and the 80% Tests of the 1940 Act in order to maintain our exempt status. As of December 31, 2010, we determined that we were in maintained compliance with both the 55% Test and the 80% Test requirements.
We calculate that at least 75% of our assets were qualified REIT assets, as defined in the Code for the year ended December 31, 2010. We also calculate that our revenue qualifies for the 75% source of income test and for the 95% source of income test rules for the year ended December 31, 2010. Consequently, we met the REIT income and asset tests. We also met all REIT requirements regarding the ownership of our common stock and the distribution of our net income. Therefore, for the year ended December 31, 2010, we believe that we qualified as a REIT under the Code.
Item 7A. Quantitative and Qualitative Disclosures about Market Risk
We seek to manage our risks related to the credit quality of our assets, interest rates, liquidity, prepayment speeds and market value while providing an opportunity to stockholders to realize attractive risk-adjusted returns through ownership of our capital stock. Although we do not seek to avoid risk completely, we believe that risk can be quantified from historical experience and we seek to manage our risk levels in order to earn sufficient compensation to justify the risks we undertake and to maintain capital levels consistent with taking such risks.
To reduce the risks to our portfolio, we employ portfolio-wide and security-specific risk measurement and management processes in our daily operations. PRCM Advisers' risk management tools include software and services licensed or purchased from third parties, in addition to proprietary software and analytical methods developed by Pine River. There can be no guarantee that these tools will protect us from market risks.
Interest Rate Risk
Interest rates are highly sensitive to many factors, including fiscal and monetary policies and domestic and international economic and political considerations, as well as other factors beyond our control. We are subject to interest rate risk in connection with our assets and related financing obligations. Subject to maintaining our qualification as a REIT, we engage in a variety of interest rate management techniques that seek to mitigate the influence of interest rate changes on the values of our assets.
We utilize U.S. Treasuries as well as derivative financial instruments, currently limited to interest rate swaps, swaptions, TBAs, and to a certain extent inverse interest-only securities, as of December 31, 2010, to hedge the interest rate risk associated with our portfolio. We seek to hedge interest rate risk with respect to both the fixed income nature of our assets and the financing of our portfolio. In hedging interest rates with respect to our fixed income assets, we seek to reduce the risk of losses on the value of our investments that may result from changes in interest rates in the broader markets. In utilizing interest rate hedges with respect to our financing, we seek to improve risk-adjusted returns and, where possible, to obtain a favorable spread between the yield on our assets and the cost of our financing. We rely on PRCM Advisers' expertise to manage these risks on our behalf. We implement part of our hedging strategy through Capitol, our TRS, which is subject to U.S. federal, state and, if applicable, local income tax.
Interest Rate Effect on Net Interest Income
Our operating results depend in large part on differences between the income earned on our assets and our cost of borrowing and hedging activities. The costs associated with our borrowings are generally based on prevailing market interest rates. During a period of rising interest rates, our borrowing costs generally will increase while the yields earned on our leveraged fixed-rate RMBS will remain static. Moreover, interest rates may rise at a faster pace than the yields earned on our leveraged adjustable-rate and hybrid RMBS. Both of these factors could result in a decline in our net interest spread and net interest margin. The severity of any such decline would depend on our asset/liability composition at the time, as well as the magnitude and duration of the interest rate increase. Further, an increase in short-term interest rates could also have a negative impact on the market value of our target assets. If any of these events happen, we could experience a decrease in net income or incur a net loss during these periods, which could adversely affect our liquidity and results of operations.
Our hedging techniques are partly based on assumed levels of prepayments of our target assets. If prepayments are slower or faster than assumed, the life of the investment will be longer or shorter, which would reduce the effectiveness of any hedging strategies we may use and may cause losses on such transactions. Hedging strategies involving the use of derivative securities are highly complex and may produce volatile returns.
We acquire adjustable-rate and hybrid RMBS. These are assets in which some of the underlying mortgages are typically subject to periodic and lifetime interest rate caps and floors, which may limit the amount by which the security's interest yield may change during any given period. However, our borrowing costs pursuant to our financing agreements are not subject to similar restrictions. Therefore, in a period of increasing interest rates, interest rate costs on our borrowings could increase without limitation, while the interest-rate yields on our adjustable-rate and hybrid RMBS could effectively be limited by caps. This issue will be magnified to the extent we acquire adjustable-rate and hybrid RMBS that are not based on mortgages that are fully indexed. In addition, adjustable-rate and hybrid RMBS may be subject to periodic payment caps that result in some portion of the interest being deferred and added to the principal outstanding. If this happens, we could receive less cash income on such assets than we would need to pay for interest costs on our related borrowings. These factors could lower our net interest income or cause a net loss during periods of rising interest rates, which would harm our financial condition, cash flows and results of operations.
Interest Rate Mismatch Risk
We fund the majority of our adjustable-rate and hybrid Agency RMBS assets with borrowings that are based on LIBOR, while the interest rates on these assets may be indexed to other index rates, such as the one-year Constant Maturity Treasury index, or CMT, the Monthly Treasury Average index, or MTA, or the 11th District Cost of Funds Index, or COFI. Accordingly, any increase in LIBOR relative to these indices may result in an increase in our borrowing costs
that is not matched by a corresponding increase in the interest earnings on these assets. Any such interest rate index mismatch could adversely affect our profitability, which may negatively impact distributions to our stockholders. To mitigate interest rate mismatches, we utilize the hedging strategies discussed above.
The following table provides the indices of our variable rate assets as of December 31, 2010 and December 31, 2009, respectively, based on total notional amount of bonds (dollars in thousands).
| | | | | | | | | | | | | | | | | | | | | | | | | | | | | | |
| | As of December 31, 2010 | | As of December 31, 2009 |
Index Type | | Floating | | Hybrid(1) | | Total | | Index Percentage | | Floating | | Hybrid(1) | | Total | | Index Percentage |
CMT | | $ | — | | | $ | 205,728 | | | $ | 205,728 | | | 40 | % | | $ | 107,668 | | | $ | 124,833 | | | $ | 232,501 | | | 62 | % |
LIBOR | | 223,643 | | | 49,904 | | | 273,547 | | | 53 | % | | 74,453 | | | 40,014 | | | 114,467 | | | 31 | % |
Other(2) | | 17,722 | | | 18,032 | | | 35,754 | | | 7 | % | | 6,522 | | | 18,385 | | | 24,907 | | | 7 | % |
Total | | $ | 241,365 | | | $ | 273,664 | | | $ | 515,029 | | | 100 | % | | $ | 188,643 | | | $ | 183,232 | | | $ | 371,875 | | | 100 | % |
____________________
(1) Hybrid amounts reflect those assets with greater than 12 months to reset.
(2) Other - includes COFI, MTA and other indices.
Our analysis of risks is based on PRCM Advisers and its affiliates' experience, estimates, models and assumptions. These analyses rely on models which utilize estimates of fair value and interest rate sensitivity. Actual economic conditions or implementation of decisions by PRCM Advisers may produce results that differ significantly from the estimates and assumptions used in our models.
We use a variety of recognized industry models, as well as proprietary models, to perform sensitivity analyses which are derived from primary assumptions for prepayment rates, discount rates and credit losses. The primary assumption used in this model is implied market volatility of interest rates. The information presented in the following interest sensitivity table projects the potential impact of sudden parallel changes in interest rates on our financial results and financial condition over the next 12 months, based on our interest sensitive financial instruments at December 31, 2010.
All changes in value are measured as the change from the December 31, 2010 financial position. All projected changes in annualized net interest income are measured as the change from the projected annualized net interest income based off current performance returns.
| | | | | | | | | | | | | | | |
| Changes in Interest Rates |
(dollars in thousands) | -100 bps | | -50 bps | | +50 bps | | +100 bps |
Change in value of financial position: | | | | | | | |
Available-for-sale securities, at fair value | $ | 25,922 | | | $ | 14,908 | | | $ | (10,703 | ) | | $ | (28,087 | ) |
As a % of December 31, 2010 equity | 6.8 | % | | 3.9 | % | | (2.8 | )% | | (7.3 | )% |
Trading securities, at fair value | $ | 1,734 | | | $ | 1,734 | | | $ | (1,728 | ) | | $ | (3,436 | ) |
As a % of December 31, 2010 equity | 0.5 | % | | 0.5 | % | | (0.5 | )% | | (0.9 | )% |
Derivatives, at fair value, net | $ | (22,738 | ) | | $ | (12,349 | ) | | $ | 12,870 | | | $ | 26,048 | |
As a % of December 31, 2010 equity | (5.9 | )% | | (3.2 | )% | | 3.4 | % | | 6.8 | % |
Repurchase Agreements | $ | (533 | ) | | $ | (658 | ) | | $ | 1,025 | | | $ | 2,050 | |
As a % of December 31, 2010 equity | (0.1 | )% | | (0.2 | )% | | 0.3 | % | | 0.5 | % |
Total Net Assets | $ | 4,385 | | | $ | 3,635 | | | $ | 1,464 | | | $ | (3,425 | ) |
As a % of December 31, 2010 total assets | 0.2 | % | | 0.2 | % | | 0.1 | % | | (0.2 | )% |
As a % of December 31, 2010 equity | 1.3 | % | | 1.0 | % | | 0.4 | % | | (0.9 | )% |
| -100 bps | | -50 bps | | +50 bps | | +100 bps |
Change in annualized net interest income: | $ | (205 | ) | | $ | (20 | ) | | $ | 204 | | | $ | 408 | |
% change in net interest income | (0.3 | )% | | — | % | | 0.3 | % | | 0.6 | % |
The AFS securities, at fair value, included in the interest rate sensitivity table “change in value of financial position” were limited to Agency RMBS. Due to our non-Agency RMBS's significantly discounted prices and underlying credit risks, we believe our non-Agency RMBS's valuation is inherently de-sensitized to changes in interest rates. As such, we cannot project the impact to these financial instruments and have excluded these RMBS from the interest rate sensitivity
analysis. These non-Agency RMBS have been included in the “change in annualized net interest income” analysis.
Certain assumptions have been made in connection with the calculation of the information set forth in the foregoing interest rate sensitivity table and, as such, there can be no assurance that assumed events will occur or that other events will not occur that would affect the outcomes. The base interest rate scenario assumes interest rates at December 31, 2010. The analysis presented utilizes assumptions and estimates based on management's judgment and experience. Furthermore, while we generally expect to retain such assets and the associated interest rate risk to maturity, future purchases and sales of assets could materially change our interest rate risk profile.
The interest rate sensitivity table quantifies the potential changes in net interest income and portfolio value, which includes the value of swaps and our other derivatives, should interest rates immediately change. The interest rate sensitivity table presents the estimated impact of interest rates instantaneously rising 50 and 100 basis points, and falling 50 and 100 basis points. The cash flows associated with the portfolio of RMBS for each rate change are calculated based on assumptions, including prepayment speeds, yield on future acquisitions, slope of the yield curve, and size of the portfolio. Assumptions made on the interest rate sensitive liabilities, which are assumed to relate to repurchase agreements, including anticipated interest rates, collateral requirements as a percent of the repurchase agreement, amount and term of borrowing.
The change in annualized net interest income does not include any benefit or detriment from faster or slower prepayment rates on our Agency premium bonds, non-Agency discount bonds, and instruments that represent the interest payments (but not the principal) on a pool of mortgages, or interest-only bonds. We anticipate that faster prepayment speeds in lower interest rate scenarios will generate lower realized yields on Agency premium and interest-only bonds and higher realized yields on non-Agency discount bonds. Similarly, we anticipate that slower prepayment speeds in higher interest rate scenarios will generate higher realized yields on Agency premium and interest-only bonds and lower realized yields on non-Agency discount bonds. Although we have sought to construct the portfolio to limit the effect of changes in prepayment speeds, there can be no assurance this will actually occur, and the realized yield of the portfolio may be significantly different than we anticipate in changing interest rate scenarios.
Given the low interest rates at December 31, 2010, we applied a floor of 0% for all anticipated interest rates included in our assumptions. Because of this floor, we anticipate that any hypothetical interest rate shock decrease would have a limited positive impact on our funding costs; however, because prepayments speeds are unaffected by this floor, we expect that any increase in our prepayment speeds (occurring as a result of any interest rate decrease or otherwise) could result in an acceleration of our premium amortization on Agency and interest-only bonds purchased at a premium, and accretion of discount on our non-Agency bonds purchased at a discount. As a result, because this floor limits the positive impact of any interest rate decrease on our funding costs, hypothetical interest rate decreases could cause the fair value of our financial instruments and our net interest income to decline.
The information set forth in the interest rate sensitivity table and all related disclosures constitutes forward-looking statements within the meaning of Section 27A of the Securities Act of 1933, or the Securities Act, and Section 21E of the Securities Exchange Act of 1934, or the Exchange Act. Actual results could differ significantly from those estimated in the foregoing interest rate sensitivity table.
Prepayment Risk
Prepayment risk is the risk that principal will be repaid at a different rate than anticipated. As we receive prepayments of principal on our assets, premiums paid on such assets will be amortized against interest income. In general, an increase in prepayment rates will accelerate the amortization of purchase premiums, thereby reducing the interest income earned on the assets. Conversely, discounts on such assets are accreted into interest income. In general, an increase in prepayment rates will accelerate the accretion of purchase discounts, thereby increasing the interest income earned on the assets.
Normally, we believe that we will be able to reinvest proceeds from scheduled principal payments and prepayments at acceptable yields; however, no assurances can be given that, should significant prepayments occur, market conditions would be such that acceptable investments could be identified and the proceeds timely reinvested.
Market Risk
Market Value Risk. Our AFS securities are reflected at their estimated fair value, with the difference between amortized cost and estimated fair value reflected in accumulated other comprehensive income. The estimated fair value of these securities fluctuates primarily due to changes in interest rates and other factors. Generally, in a rising interest rate environment, we would expect the fair value of these securities to decrease; conversely, in a decreasing interest rate environment, we would expect the fair value of these securities to increase. As market volatility increases or liquidity decreases, the fair value of our assets may be adversely impacted.
Real estate risk. RMBS and residential property values are subject to volatility and may be affected adversely by a number of factors, including national, regional and local economic conditions; local real estate conditions (such as an oversupply of housing); changes or continued weakness in specific industry segments; construction quality, age and design; demographic factors; and retroactive changes to building or similar codes. Decreases in property values reduce the
value of the collateral for mortgage loans and the potential proceeds available to borrowers to repay the loans, which could cause us to suffer losses on our non-Agency RMBS investments.
Liquidity Risk
Our liquidity risk is principally associated with our financing of long-maturity assets with short-term borrowings in the form of repurchase agreements. Although the interest rate adjustments of these assets and liabilities fall within the guidelines established by our operating policies, maturities are not required to be nor are they, matched.
Should the value of our assets pledged as collateral suddenly decrease, margin calls relating to our repurchase agreements could increase, causing an adverse change in our liquidity position. Additionally, if one or more of our repurchase agreement counterparties chose not to provide on-going funding, our ability to finance would decline or exist at possibly less advantageous terms. As such, we cannot assure that we will always be able to roll over our repurchase agreements. See Item 7, "Management's Discussion and Analysis of Financial Condition and Results of Operations - Liquidity and Capital Resources" in this Annual Report on Form 10-K for further information about our liquidity and capital resource management.
Credit Risk
We believe that our investment strategy will generally keep our risk of credit losses low to moderate. However, we retain the risk of potential credit losses on all of the loans underlying our non-Agency RMBS. With respect to our non-Agency RMBS that are senior in the credit structure, credit support contained in RMBS deal structures provide a level of protection from losses. We seek to manage the remaining credit risk through our pre-acquisition due diligence process, and by factoring assumed credit losses into the purchase prices we pay for non-Agency RMBS. In addition, with respect to any particular target asset, PRCM Advisers' investment team evaluates relative valuation, supply and demand trends, shape of yield curves, prepayment rates, delinquency and default rates, recovery of various sectors and vintage of collateral. We may at times in the future enter into credit default swaps or other derivative instruments in an attempt to manage our credit risk. Nevertheless, unanticipated credit losses could adversely affect our operating results.
Item 8. Financial Statements and Supplementary Data
TWO HARBORS INVESTMENT CORP.
INDEX TO CONSOLIDATED FINANCIAL STATEMENTS
Report of Independent Registered Public Accounting Firm
The Board of Directors and Stockholders
of Two Harbors Investment Corp.
We have audited the accompanying consolidated balance sheets of Two Harbors Investment Corp. (the Company) as of December 31, 2010 and 2009, and the related consolidated statements of income (loss), stockholders' equity and comprehensive income (loss), and cash flows for the years then ended. These financial statements are the responsibility of the Company's management. Our responsibility is to express an opinion on these financial statements based on our audits.
We conducted our audits in accordance with the standards of the Public Company Accounting Oversight Board (United States). Those standards require that we plan and perform the audit to obtain reasonable assurance about whether the financial statements are free of material misstatement. An audit includes examining, on a test basis, evidence supporting the amounts and disclosures in the financial statements. An audit also includes assessing the accounting principles used and significant estimates made by management, as well as evaluating the overall financial statement presentation. We believe that our audit provides a reasonable basis for our opinion.
In our opinion, the financial statements referred to above present fairly, in all material respects, the consolidated financial position of Two Harbors Investment Corp. at December 31, 2010 and 2009, and the consolidated results of its operations and its cash flows for the years then ended, in conformity with U.S. generally accepted accounting principles.
We also have audited, in accordance with the standards of the Public Company Accounting Oversight Board (United States), Two Harbor Investment Corp.'s internal control over financial reporting as of December 31, 2010, based on criteria established in Internal Control-Integrated Framework issued by the Committee of Sponsoring Organizations of the Treadway Commission and our report dated March 4, 2011 expressed an unqualified opinion thereon.
/s/ Ernst & Young LLP
Ernst & Young LLP
Minneapolis, Minnesota
March 4, 2011
REPORT OF INDEPENDENT REGISTERED PUBLIC ACCOUNTING FIRM
To the Audit Committee of the Board of Directors and Stockholders of
Capitol Acquisition Corp.
We have audited the accompanying statements of income, stockholders' equity, and cash flows of Capitol Acquisition Corp. (a development stage company) (the “Company”) for the year ended December 31, 2008. These financial statements are the responsibility of the Company's management. Our responsibility is to express an opinion on these financial statements based on our audit.
We conducted our audit in accordance with the standards of the Public Company Accounting Oversight Board (United States). Those standards require that we plan and perform the audit to obtain reasonable assurance about whether the financial statements are free of material misstatement. An audit also includes examining, on a test basis, evidence supporting the amounts and disclosures in the financial statements, assessing the accounting principles used and significant estimates made by management, as well as evaluating the overall financial statement presentation. We believe that our audit provides a reasonable basis for our opinion.
The accompanying financial statements have been prepared assuming that the Company will continue as a going concern. As discussed in Note 1 to the financial statements included in the December 31, 2008 Form 10-K of Capitol Acquisition Corp., the Company's certificate of incorporation provides for mandatory liquidation of the Company in the event that the Company does not consummate a business combination (as defined) prior to November 8, 2009. This condition raises a substantial doubt about its ability to continue as a going concern. Management's plans regarding these matters are described in Note 1 to the financial statements included in the December 31, 2008 Form 10-K of Capitol Acquisition Corp. The financial statements do not include any adjustments that might result from the outcome of this uncertainty.
In our opinion, the financial statements referred to above present fairly, in all material respects, the results of operations and cash flows of Capitol Acquisition Corp. (a development stage company) for the year ended December 31, 2008 in conformity with United States generally accepted accounting principles.
/s/ Marcum LLP
Marcum LLP
(formerly Marcum & Kliegman LLP)
Melville, New York
March 13, 2009
TWO HARBORS INVESTMENT CORP.
CONSOLIDATED BALANCE SHEETS
(in thousands, except share data)
| | | | | | | |
| December 31,
2010 | | December 31,
2009 |
ASSETS | | | | | |
Available-for-sale securities, at fair value | $ | 1,354,405 | | | $ | 494,465 | |
Trading securities, at fair value | 199,523 | | | — | |
Cash and cash equivalents | 163,900 | | | 26,105 | |
Total earning assets | 1,717,828 | | | 520,570 | |
Restricted cash | 22,548 | | | 8,913 | |
Accrued interest receivable | 5,383 | | | 2,580 | |
Due from counterparties | 12,304 | | | 4,877 | |
Derivative assets, at fair value | 38,109 | | | 364 | |
Other assets | 1,260 | | | 1,062 | |
Total Assets | $ | 1,797,432 | | | $ | 538,366 | |
LIABILITIES AND STOCKHOLDERS’ EQUITY | | | | | |
Liabilities | | | | | |
Repurchase agreements | $ | 1,169,803 | | | $ | 411,893 | |
Accrued interest payable | 785 | | | 114 | |
Due to counterparties | 231,724 | | | — | |
Accrued expenses and other liabilities | 2,063 | | | 1,030 | |
Dividends payable | 10,450 | | | 3,484 | |
Other liabilities | 159 | | | 124 | |
Total liabilities | 1,414,984 | | | 416,645 | |
Stockholders’ Equity | | | | | |
Preferred stock, par value $0.01per share; 50,000,000 shares authorized; no shares issued and outstanding | — | | | — | |
Common stock, par value $0.01per share; 450,000,000 shares authorized and 40,501,212 and 13,401,368 shares issued and outstanding, respectively | 405 | | | 134 | |
Additional paid-in capital | 366,974 | | | 131,756 | |
Accumulated other comprehensive income (loss) | 22,619 | | | (950 | ) |
Cumulative earnings (losses) | 30,020 | | | (5,735 | ) |
Cumulative distributions to stockholders | (37,570 | ) | | (3,484 | ) |
Total stockholders’ equity | 382,448 | | | 121,721 | |
Total Liabilities and Stockholders’ Equity | $ | 1,797,432 | | | $ | 538,366 | |
The accompanying notes are an integral part of these consolidated financial statements.
TWO HARBORS INVESTMENT CORP.
CONSOLIDATED STATEMENTS OF INCOME (LOSS)
(in thousands, except share data)
| | | | | | | | | | | |
| Year Ended |
| December 31, |
| 2010 | | 2009 | | 2008 |
Interest income: | | | | | | | |
Available-for-sale securities | $ | 39,844 | | | $ | 2,796 | | | $ | — | |
Trading securities | 170 | | | — | | | — | |
Cash and cash equivalents | 107 | | | 70 | | | 4,443 | |
Total interest income | 40,121 | | | 2,866 | | | 4,443 | |
Interest expense | 4,421 | | | 131 | | | — | |
Net interest income | 35,700 | | | 2,735 | | | 4,443 | |
Other income: | | | | | |
Gain on investment securities, net | 6,127 | | | 336 | | | — | |
Gain (loss) on interest rate swap and swaption agreements | (6,344 | ) | | 364 | | | — | |
Gain on other derivative instruments | 7,156 | | | — | | | — | |
Total other income | 6,939 | | | 700 | | | — | |
Expenses: | | | | | |
Management fees | 2,989 | | | 326 | | | — | |
Costs associated with business combination | — | | | 9,572 | | | — | |
Costs associated with Capitol as a development stage company | — | | | 1,347 | | | 1,060 | |
Other operating expenses | 4,578 | | | 1,252 | | | — | |
Total expenses | 7,567 | | | 12,497 | | | 1,060 | |
Net income (loss) before income taxes | 35,072 | | | (9,062 | ) | | 3,383 | |
Benefit from (provision for) income taxes | 683 | | | 318 | | | (1,088 | ) |
Net income (loss) | 35,755 | | | (8,744 | ) | | 2,295 | |
Accretion of trust account income relating to common stock subject to possible conversion | — | | | (93 | ) | | (236 | ) |
Net income (loss) attributable to common stockholders | $ | 35,755 | | | $ | (8,837 | ) | | $ | 2,059 | |
Basic and diluted earnings (loss) per weighted average common share | $ | 1.60 | | | $ | (0.39 | ) | | $ | 0.08 | |
Dividends declared per common share | $ | 1.48 | | | $ | 0.26 | | | $ | — | |
Basic and diluted weighted average number of shares of common stock | 22,381,683 | | | 22,941,728 | | | 24,936,558 | |
The accompanying notes are an integral part of these consolidated financial statements.
TWO HARBORS INVESTMENT CORP.
CONSOLIDATED STATEMENTS OF STOCKHOLDERS' EQUITY
AND COMPREHENSIVE INCOME (LOSS)
(in thousands, except share data)
| | | | | | | | | | | | | | | | | | | | | | | | | | |
| Common Stock | | | | | | | | | | |
| Shares | | Amount | | Additional Paid-in Capital | | Accumulated Other Comprehensive Income (Loss) | | Cumulative Earnings (Losses) | | Cumulative Distributions to Stockholders | | Total Stockholders' Equity |
| | | | | | | (unaudited) | | | | | | |
Balance, January 1, 2008 | 32,811,257 | | | $ | 2 | | | $ | 181,386 | | | $ | — | | | $ | 714 | | | $ | — | | | $ | 182,102 | |
Accretion of trust account income relating to common stock subject to possible conversion | — | | | — | | | (236 | ) | | — | | | — | | | — | | | (236 | ) |
Net income | — | | | — | | | — | | | — | | | 2,295 | | | — | | | 2,295 | |
Balance, December 31, 2008 | 32,811,257 | | | 2 | | | 181,150 | | | — | | | 3,009 | | | — | | | 184,161 | |
Initial capital issuance and contribution from formation of Two Harbors Investment Corp. | | | | | | 1 | | | — | | | — | | | — | | | 1 | |
Accretion of trust account income relating to common stock subject to possible conversion | — | | | — | | | (93 | ) | | — | | | — | | | — | | | (93 | ) |
Cancellation of Capitol founders' shares | (6,562,257 | ) | | — | | | 77,833 | | | — | | | — | | | — | | | 77,833 | |
Shares converted to cash by Capitol stockholders | (6,875,130 | ) | | (1 | ) | | (67,857 | ) | | — | | | — | | | — | | | (67,858 | ) |
Shares acquired by Capitol as part of forward sales agreements | (5,994,661 | ) | | — | | | (59,167 | ) | | — | | | — | | | — | | | (59,167 | ) |
Conversion of par value share price | — | | | 133 | | | (133 | ) | | — | | | — | | | — | | | — | |
Net loss | — | | | — | | | — | | | — | | | (8,744 | ) | | — | | | (8,744 | ) |
Net unrealized loss on available-for-sale securities | — | | | — | | | — | | | (950 | ) | | — | | | — | | | (950 | ) |
Total other comprehensive loss | | | | | | | (950 | ) | | | | | | | |
Total comprehensive loss | — | | | — | | | — | | | — | | | — | | | — | | | (9,694 | ) |
Common dividends declared | — | | | — | | | — | | | — | | | — | | | (3,484 | ) | | (3,484 | ) |
Non-cash equity award compensation | 22,159 | | | — | | | 22 | | | — | | | — | | | — | | | 22 | |
Balance, December 31, 2009 | 13,401,368 | | | 134 | | | 131,756 | | | (950 | ) | | (5,735 | ) | | (3,484 | ) | | 121,721 | |
Net income | — | | | — | | | — | | | — | | | 35,755 | | | — | | | 35,755 | |
Net change in unrealized gain (loss) on available-for-sale securities | — | | | — | | | — | | | 23,569 | | | — | | | — | | | 23,569 | |
Total other comprehensive income | — | | | — | | | — | | | 23,569 | | | — | | | — | | | — | |
Total comprehensive income | | | | | | | | | | | | | 59,324 | |
Net proceeds from issuance of common stock, net of offering costs | 27,063,381 | | | 271 | | | 235,004 | | | — | | | — | | | — | | | 235,275 | |
Common dividends declared | — | | | — | | | — | | | — | | | — | | | (34,086 | ) | | (34,086 | ) |
Non-cash equity award compensation | 36,463 | | | — | | | 214 | | | — | | | — | | | — | | | 214 | |
Balance, December 31, 2010 | 40,501,212 | | | $ | 405 | | | $ | 366,974 | | | $ | 22,619 | | | $ | 30,020 | | | $ | (37,570 | ) | | $ | 382,448 | |
The accompanying notes are an integral part of these consolidated financial statements.
TWO HARBORS INVESTMENT CORP.
CONSOLIDATED STATEMENTS OF CASH FLOWS
(in thousands)
| | | | | | | | | | | |
| Year Ended |
| December 31, |
| 2010 | | 2009 | | 2008 |
Cash Flows From Operating Activities: | | | | | | | |
Net income (loss) | $ | 35,755 | | | $ | (8,744 | ) | | $ | 2,295 | |
Adjustments to reconcile net income (loss) to net cash provided by (used in) operating activities: | | | | | | | |
Amortization of premiums and discounts on RMBS, net | 2,455 | | | 528 | | | — | |
Gain on investment securities, net | (6,127 | ) | | (336 | ) | | — | |
Loss on termination of interest rate swaps and swaptions | 4,446 | | | — | | | — | |
Unrealized gain on interest rate swaps and swaptions | (1,425 | ) | | (364 | ) | | |
Unrealized gain on other derivative instruments | (784 | ) | | — | | | — | |
Equity based compensation expense | 214 | | | 22 | | | — | |
Net change in: | | | | | | |
Increase in accrued interest receivable | (2,803 | ) | | (2,580 | ) | | — | |
(Decrease)/increase in deferred income taxes, net | (678 | ) | | 124 | | | — | |
Decrease/(increase) in prepaid tax asset | 490 | | | (442 | ) | | (48 | ) |
Decrease in prepaid expenses | (134 | ) | | (521 | ) | | (29 | ) |
Increase in accrued interest payable, net | 671 | | | 114 | | | — | |
(Decrease)/increase in income taxes payable, net | 1 | | | — | | | (619 | ) |
Increase in accrued expenses and other liabilities | 1,033 | | | 837 | | | 116 | |
Net cash provided by (used in) operating activities | 33,114 | | | (11,362 | ) | | 1,715 | |
Cash Flows From Investing Activities: | | | | | | | |
Purchases of available-for-sale securities | (1,363,078 | ) | | (503,064 | ) | | — | |
Proceeds from sales of available-for-sale securities | 415,824 | | | 2,464 | | | — | |
Principal payments on available-for-sale securities | 114,704 | | | 4,993 | | | — | |
Purchases of other derivative instruments | (56,461 | ) | | — | | | — | |
Proceeds from sales of other derivative instruments | 16,638 | | | — | | | — | |
Purchases of trading securities | (258,189 | ) | | — | | | — | |
Proceeds from sales of trading securities | 58,516 | | | — | | | — | |
Decrease/(increase) in due to/from counterparties, net | 224,297 | | | (4,878 | ) | | — | |
Net (increase) decrease in restricted cash | (13,635 | ) | | 250,219 | | | (786 | ) |
Decrease in cash held in trust account, interest and dividend income available for working capital and taxes | — | | | 86 | | | 1,388 | |
Net cash (used in) provided by investing activities | (861,384 | ) | | (250,180 | ) | | 602 | |
Cash Flows From Financing Activities: | | | | | | | |
Proceeds from repurchase agreements | 4,893,467 | | | 411,893 | | | — | |
Principal payments on repurchase agreements | (4,135,557 | ) | | — | | | — | |
Common stock converted to cash at business combination | — | | | (67,858 | ) | | — | |
Common stock repurchases through forward sales agreements | — | | | (59,167 | ) | | — | |
Proceeds from issuance of common stock, net of offering costs | 235,275 | | | 1 | | | — | |
Dividends paid on common stock | (27,120 | ) | | — | | | — | |
Net cash provided by financing activities | 966,065 | | | 284,869 | | | — | |
Net increase in cash and cash equivalents | 137,795 | | | 23,327 | | | 2,317 | |
Cash and cash equivalents at beginning of year | 26,105 | | | 2,778 | | | 461 | |
Cash and cash equivalents at end of year | $ | 163,900 | | | $ | 26,105 | | | $ | 2,778 | |
Supplemental Disclosure of Cash Flow Information: | | | | | | |
Cash paid for interest | $ | 3,750 | | | $ | 18 | | | $ | — | |
Cash paid (received) for taxes | $ | (497 | ) | | $ | — | | | $ | 1,795 | |
Non-Cash Financing Activity: | | | | | | | |
Dividends declared but not paid at end of period | $ | 10,450 | | | $ | 3,484 | | | $ | — | |
Accretion of trust account income relating to common stock subject to conversion | $ | — | | | $ | (93 | ) | | $ | (236 | ) |
The accompanying notes are an integral part of these consolidated financial statements.
TWO HARBORS INVESTMENT CORP.
Notes to the Consolidated Financial Statements
Note 1. Organization and Operations
Two Harbors Investment Corp., or the Company, is a Maryland corporation formed to invest primarily in residential mortgage-backed securities, or RMBS. The Company is externally managed and advised by PRCM Advisers LLC, a subsidiary of Pine River Capital Management L.P., or Pine River, a global multi-strategy asset management firm. The Company's common stock is listed on the NYSE and its warrants are listed on the NYSE Amex under the symbols “TWO” and “TWO.WS,” respectively.
The Company has elected to be treated as a real estate investment trust, or REIT, for U.S. federal income tax purposes commencing with its initial taxable period ended December 31, 2009. As long as the Company continues to comply with a number of requirements under federal tax law and maintains its qualification as a REIT, the Company generally will not be subject to U.S. federal income tax to the extent that the Company distributes its taxable income to its stockholders on an annual basis and does not engage in prohibited transactions.
On June 11, 2009, the Company, Two Harbors Merger Corp. (a wholly-owned subsidiary of the Company), Pine River and Capitol Acquisition Corp. (“Capitol”) entered into a merger agreement, which, among other things, provided for the merger of Capitol into Two Harbors Merger Corp., with Capitol being the surviving entity and becoming an indirect wholly-owned subsidiary of the Company.
Capitol, a development stage company, was formed on June 26, 2007 as a publicly registered vehicle to effect a merger, capital stock exchange, asset acquisition or other similar business combination with an operating business. On November 14, 2007, Capitol consummated its initial public offering (the “IPO”) and deposited $258,346,625 of net proceeds into a trust account (“Trust Account”), with such funds to be held in trust until the earlier of the completion of Capitol's initial business combination or November 8, 2009.
The Company was formed solely to complete the merger transaction with Capitol and, prior to such time, had no material assets or liabilities. On October 26, 2009, a majority of Capitol's stockholders approved the proposed merger transaction with the Company, and the transaction closed on October 28, 2009. As part of the merger transaction, certain of Capitol's officers, directors and special advisors (the “Initial Stockholders”) surrendered their common stock to the Company for no consideration, and their shares were canceled. At the closing of the merger transaction, certain holders of the common stock that was sold as part of the IPO elected to convert their shares to cash, or sold their shares to Capitol, in each case for a price equal to the per share value of cash held in trust, or $9.87 per share. At the closing, after deducting transaction costs and expenses, and after purchasing or converting to cash the shares of common stock of Capitol stockholders who did not elect to participate in the merger, the Company had approximately $124.0 million in cash available to fund investments and operations, and a book value of approximately $9.30 per share. The remaining Capitol stockholders, and all Capitol warrant holders, exchanged their Capitol shares and warrants for Company shares and warrants on a one-for-one basis. The new shares and warrants became available to be traded on the NYSE Amex as of October 29, 2009. The Capitol shares and warrants were retired and de-registered upon completion of the merger. Capitol ceased being a development stage company at the completion of the merger.
Upon completion of the merger, Capitol was considered the accounting acquirer, similar to a reverse merger. As the surviving entity, Capitol's financial information is presented in these financial statements on a historical carryover basis.
Note 2. Basis of Presentation and Significant Accounting Policies
Consolidation and Basis of Presentation
The accompanying consolidated financial statements include the accounts of the Company and its wholly-owned subsidiaries after eliminating all intercompany balances and transactions. The consolidated financial statements have been prepared as if the Company had been in place for all periods presented. Certain prior period amounts have been reclassified to conform to the current period presentation. The accounting and reporting policies of the Company conform to U.S. generally accepted accounting principles (“GAAP”).
Use of Estimates
The preparation of financial statements in conformity with GAAP requires us to make a number of significant estimates. These include estimates of fair value of certain assets and liabilities, amount and timing of credit losses, prepayment rates, the period of time during which the Company anticipates an increase in the fair values of real estate securities sufficient to recover unrealized losses in those securities, and other estimates that affect the reported amounts of certain assets and liabilities as of the date of the consolidated financial statements and the reported amounts of certain revenues and expenses during the reported period. It is likely that changes in these estimates (e.g., valuation changes due to supply and demand, credit performance, prepayments, interest rates, or other reasons) will occur in the near term. The
TWO HARBORS INVESTMENT CORP.
Notes to the Consolidated Financial Statements - (continued)
Company's estimates are inherently subjective in nature and actual results could differ from its estimates and the differences may be material.
Summary of Significant Accounting Policies
Investment Securities, at Fair Value
The Company invests primarily in mortgage pass-through certificates, collateralized mortgage obligations and other residential mortgage-backed securities representing interests in or obligations backed by pools of mortgage loans (collectively “RMBS”) issued by Federal National Mortgage Association (“Fannie Mae”), Federal Home Loan Mortgage Corporation (“Freddie Mac”), and Government National Mortgage Association (“GNMA”) (collectively, “the Agencies” or “GSE's”). The Company also invests in residential mortgage-backed securities that are not issued by the GSE's ("non-Agency RMBS") and U.S. Treasuries.
Designation
The Company classifies its RMBS securities as available-for-sale (“AFS”) investments. Although, the Company generally intends to hold most of its investment securities until maturity, it may, from time to time, sell any of its investment securities as part of its overall management of its portfolio. Accordingly, the Company classifies all of its RMBS investment securities as AFS including its interest-only strips, which represent the Company's right to receive a specified portion of the contractual interest flows of specific Agency securities. All assets classified as AFS are reported at estimated fair value, with unrealized gains and losses, excluding other than temporary impairments, included in accumulated other comprehensive income, a separate component of stockholders' equity, on an after-tax basis.
The Company classifies its U.S. Treasuries as trading securities. The Company's trading securities are carried at estimated fair value with changes in fair value recorded as a component of net gain (loss) on investment securities in the consolidate statement of income.
Determination of RMBS Fair Value
Fair value is determined under the guidance of ASC 820, Fair Value Measurements and Disclosures (“ASC 820”). The Company determines the fair value of its Agency RMBS and U.S. Treasuries based upon prices obtained from third-party pricing providers or broker quotes received using bid price, which are both deemed indicative of market activity. In determining the fair value of its non-Agency RMBS, management judgment is used to arrive at fair value that considers prices obtained from third-party pricing providers, broker quotes received and other applicable market data.
If listed price data is not available or insufficient, then fair value is based upon internally developed models that are primarily based on observable market-based inputs but also include unobservable market data inputs. The Company classifies these securities as Level 3 assets. As of December 31, 2010, 0.6% of the investment securities portfolio is categorized as Level 3.
The Company's application of ASC 820 guidance is discussed in further detail in Note 8 - Fair Value of these notes to the consolidated financial statements.
Revenue Recognition, Premium Amortization and Discount Accretion
Interest income on securities is accrued based on the outstanding principal balance and their contractual terms as prescribed by codified guidance in ASC 320, Investments in Debt and Equity Securities (“ASC 320”). Premiums and discounts associated with RMBS that are issued or guaranteed as to principal and/or interest by a federally chartered corporation, such as Fannie Mae or Freddie Mac, or an agency of the U.S. Government, such as Ginnie Mae (collectively, “Agency RMBS”) and non-Agency RMBS rated AA and higher at the time of purchase, are amortized into interest income over the life of such securities using the effective yield method. Adjustments to premium amortization are made for actual prepayment activity. The Company estimates prepayments for its Agency interest-only securities, which represent the Company's right to receive a specified portion of the contractual interest flows of specific Agency and CMO securities. As a result, if prepayments increase (or are expected to increase), the Company will accelerate the rate of amortization on the premiums.
Interest income on the non-Agency RMBS that were purchased at a discount to par value and/or were rated below AA at the time of purchase is recognized based on the security's effective interest rate. The effective interest rate on these securities is based on the projected cash flows from each security, which are estimated based on the Company's observation of current information and events and include assumptions related to interest rates, prepayment rates and the timing and amount of credit losses. On at least a quarterly basis, the Company reviews and, if appropriate, makes adjustments to its cash flow projections based on input and analysis received from external sources, internal models, and its judgment about interest rates, prepayment rates, the timing and amount of credit losses, and other factors. Changes in
TWO HARBORS INVESTMENT CORP.
Notes to the Consolidated Financial Statements - (continued)
cash flows from those originally projected, or from those estimated at the last evaluation, may result in a prospective change in the yield/interest income recognized on such securities. Actual maturities of the available-for-sale securities are affected by the contractual lives of the associated mortgage collateral, periodic payments of principal, and prepayments of principal. Therefore actual maturities of available-for-sale securities are generally shorter than stated contractual maturities. Stated contractual maturities are generally greater than ten years. There can be no assurance that the Company's assumptions used to estimate future cash flows or the current period's yield for each asset would not change in the near term, and the change could be material.
Based on the projected cash flows from the Company's non-Agency RMBS purchased at a discount to par value, a portion of the purchase discount may be designated as credit protection against future credit losses and, therefore, not accreted into interest income. The amount designated as credit discount may be adjusted over time, based on the actual performance of the security, its underlying collateral, actual and projected cash flow from such collateral, economic conditions and other factors. If the performance of a security with a credit discount is more favorable than forecasted, a portion of the amount designated as credit discount may be accreted into interest income prospectively. Conversely, if the performance of a security with a credit discount is less favorable than forecasted an impairment charge and write-down of such security to a new cost basis results.
Impairment
The Company evaluates its investment securities, on a quarterly basis, to assess whether a decline in the fair value of an available-for-sale security below the Company's amortized cost basis is an other-than-temporary impairment (“OTTI”). Based on the codified guidance of ASC 320, the presence of OTTI is based upon a fair value decline below a security's amortized cost basis and a corresponding adverse change in expected cash flows due to credit related factors as well as non-credit factors, such as changes in interest rates and market spreads. ASC 320 requires impairment to be considered other-than-temporary if an entity (i) intends to sell the security, (ii) will more likely than not be required to sell the security before it recovers in value, or (iii) does not expect to recover the security's amortized cost basis, even if the entity does not intend to sell the security. Under these scenarios, the impairment is other-than-temporary and the full amount of impairment should be recognized currently in earnings and the cost basis of the investment security is adjusted. However, if an entity does not intend to sell the impaired debt security and it is more likely than not that it will not be required to sell before recovery, the OTTI should be separated into (i) the estimated amount relating to credit loss (“credit” component), and (ii) the amount relating to all other factors (“non-credit” component). Only the estimated credit loss amount is recognized currently in earnings, with the remainder of the loss amount recognized in other comprehensive income. The difference between the new amortized cost basis and the cash flows expected to be collected is accreted as interest income in accordance with the effective interest method.
Balance Sheet Presentation
Investment securities transactions are recorded on the trade date. Purchases of newly-issued securities are recorded when all significant uncertainties regarding the characteristics of the securities are removed, generally shortly before settlement date. Realized gains and losses on sales of investment securities are determined on the first-in, first-out (“FIFO”) method.
Cash and Cash Equivalents
Cash and cash equivalents include cash held in bank accounts and cash held in money market funds on an overnight basis.
Restricted Cash
Restricted cash represents the Company's cash held by counterparties as collateral against the Company's securities, derivatives and/or repurchase agreements and the restricted portion of the funds held in the Capitol trust account, prior to the merger with the Company. Cash held by counterparties as collateral, which resides in non-interest bearing accounts, is not available to the Company for general corporate purposes, but may be applied against amounts due to securities, derivatives or repurchase counterparties or returned to the Company when the collateral requirements are exceeded or, at the maturity of the derivative or repurchase agreement.
Accrued Interest Receivable
Accrued interest receivable represents interest that is due and payable to the Company. Cash interest is generally received within thirty days of recording the receivable.
Due from/to Counterparties, net
Due from Counterparties includes cash held by counterparties for payment of principal and interest. Due to counterparties includes cash payable by the Company upon settlement of trade positions. Due from counterparties also
TWO HARBORS INVESTMENT CORP.
Notes to the Consolidated Financial Statements - (continued)
includes cash held by counterparties as collateral against the Company's derivatives and/or repurchase agreements but represents excess capacity and deemed unrestricted and a receivable from the counterparty as of the balance sheet date.
Derivative Financial Instruments, at Fair Value
In accordance with codified guidance of ASC 815 - Derivatives and Hedging (“ASC 815”), all derivative financial instruments, whether designated for hedging relationships or not, are recorded on the consolidated balance sheet as assets or liabilities and carried at fair value.
At the inception of a derivative contract, the Company determines whether the instrument will be part of a qualifying hedge accounting relationship or whether the Company will account for the contract as a trading instrument. Due to the volatility of the credit markets and difficulty in effectively matching pricing or cash flows, the Company has elected to treat all current derivative contracts as trading instruments. The changes in fair value of derivatives accounted for as trading instruments are reported in the consolidated statements of income (loss) as gain (loss) on interest rate swap and swaption agreements, as these contracts are hedging interest rate risk associated with the Company's repurchase agreements.
The Company enters into interest rate derivative contracts for a variety of reasons, including minimizing significant fluctuations in earnings or market values on certain assets or liabilities that may be caused by changes in interest rates. The Company may, at times, enter into various forward contracts including short securities, Agency to-be-announced securities (“TBAs”), options, futures, swaps, and caps. Due to the nature of these instruments, they may be in a receivable/asset position or a payable/liability position at the end of an accounting period. Amounts payable to, and receivable from, the same party under contracts may be offset as long as the following conditions are met: (a) each of the two parties owes the other determinable amounts; (b) the reporting party has the right to offset the amount owed with the amount owed by the other party; (c) the reporting party intends to offset; and (d) the right of offset is enforceable by law. If the aforementioned conditions are not met, amounts payable to and receivable from are presented by the Company on a gross basis in the consolidated balance sheet.
The Company has provided specific disclosure regarding the location and amounts of derivative instruments in the financial statements and how derivative instruments and related hedged items are accounted for. See Note 7 - Derivative Instruments and Hedging Activities of these notes to the consolidated financial statements.
Repurchase Agreements
The Company finances the acquisition of certain of its investment securities through the use of repurchase agreements. The repurchase agreements are all short-term debt, which expire within one year. Borrowings under repurchase agreements generally bear interest rates of a specified margin over one-month LIBOR and are generally uncommitted. The repurchase agreements are treated as collateralized financing transactions and are carried at their contractual amounts, as specified in the respective agreements.
Accrued Interest Payable
Accrued interest payable represents interest that is due and payable to third parties. Interest is generally paid within thirty days to three months of recording the payable, based upon the Company's remittance requirements.
Deferred Tax Liabilities
Income recognition for GAAP and tax differ in certain respects. These differences often reflect differing accounting treatments for tax and GAAP, such as accounting for discount and premium amortization, credit losses, asset impairments, recognition of certain operating expenses and certain valuation estimates. Some of these differences are temporary in nature and create timing mismatches between when taxable income is earned and the tax is paid versus when the GAAP income is recognized and the tax provision is recorded. Some of these differences are permanent since certain income (or expense) may be recorded for tax but not for GAAP (or vice-versa). One such significant permanent difference is the Company's ability as a REIT to deduct dividends paid to shareholders as an expense for tax, but not for GAAP.
As a result of these differences, the Company's taxable REIT subsidiary, or TRS, may recognize taxable income in periods prior or subsequent to when it recognizes income for GAAP. When this occurs, the TRS pays or defers the tax liability and establishes a deferred tax asset or deferred tax liability, respectively, for GAAP.
As the income is subsequently realized in future periods under GAAP, the deferred tax asset is recognized as an expense. Alternatively, as the TRS realizes the deferred taxable income, the deferred tax liability is recognized as a reduction to taxable income. The Company's deferred tax assets and/or liabilities are generated solely by differences in GAAP and taxable income at our taxable subsidiary. GAAP and tax differences in the REIT may create additional deferred tax assets to the extent the Company does not distribute all of its taxable income
Income Taxes
TWO HARBORS INVESTMENT CORP.
Notes to the Consolidated Financial Statements - (continued)
The Company intends to elect to be taxed as a REIT under the Internal Revenue Code (“Code”) and the corresponding provisions of state law. To qualify as a REIT, the Company must distribute at least 90% of its annual REIT taxable income to shareholders (not including taxable income retained in its taxable subsidiaries) within the time frame set forth in the tax Code and the Company must also meet certain other requirements. In addition, because certain activities, if performed by the Company, may cause the Company to earn income which is not qualifying for the REIT gross income tests, the Company has formed taxable REIT subsidiaries, as defined in the Code, to engage in such activities. These taxable REIT subsidiaries activities are subject to income taxes as well as any REIT taxable income not distributed to shareholders.
The Company assesses its tax positions for all open tax years and determines whether the Company has any material unrecognized liabilities in accordance with ASC 740, Income Taxes. The Company records these liabilities to the extent the Company deems them more likely than not to be incurred. The Company classifies interest and penalties on material uncertain tax positions as interest expense and operating expense, respectively, in its consolidated statements of (loss) income.
As of October 28, 2009 and the periods prior to that date, Capitol's operations were taxable as a domestic C corporation and subject to federal, state, and local income taxes based upon its taxable income (loss).
Earnings (Loss) Per Share
Basic and diluted earnings (loss) per share are computed by dividing net income (loss) attributable to other common stockholders by the weighted average number of common shares and potential common shares outstanding during the period. For both basic and diluted per share calculations, potential common shares represents issued and unvested shares of restricted stock, which have full rights to the common stock dividend declarations of the Company. In accordance with ASC 260 Earnings Per Share (“ASC 260”), if there is a loss from continuing operations, the common stock equivalents are deemed anti-dilutive and earnings (loss) per share is calculated excluding the potential common shares.
Other Comprehensive Income (Loss)
Current period net unrealized gains and losses on available-for-sale securities are reported as components of accumulated other comprehensive income (loss) on our consolidated statements of stockholders' equity and comprehensive income (loss). Net unrealized gains and losses on securities held by our taxable subsidiaries that are reported in accumulated other comprehensive income (loss) are adjusted for the effects of taxation and may create deferred tax assets or liabilities.
The Company did not recognize other-than-temporary impairments in its securities portfolio during the year ended December 31, 2010.
Accretion of Trust Account Income Relating to Common Stock Subject to Possible Conversion
The Company recorded accretion of the income earned in the Trust Account relating to the common stock subject to possible conversion based on the excess of the earnings for the period over the amount which is available to be used for working capital and taxes. Since 30% (less one share) of the shares issued in the Capitol initial public offering were subject to possible conversion, the portion of the excess earnings is presented as a deduction from net income on the Statements of Income (Loss) to appropriately reflect the amount of net income which would remain available to the common stockholders who did not elect to convert their shares to cash. The accretion of income earned in the Trust Account relating to the common stock subject to possible conversion was $235,706 for the year ended December 31, 2008. For the year ended December 31, 2009, the accretion of income earned in the Trust Account, prior to the business combination was $92,872.
Equity Incentive Plan
The Company has adopted an equity incentive plan in 2009 which provides incentive compensation to attract and retain qualified directors, officers, advisors, consultants and other personnel, including PRCM Advisers LLC and its affiliates. The 2009 equity incentive plan is administered by the compensation committee of the Company's board of directors. The 2009 equity incentive plan permits the granting of restricted shares of common stock, phantom shares, dividend equivalent rights and other equity-based awards.
The cost of equity awards is determined in accordance with ASC 718, Compensation - Stock Compensation (“ASC 718”) and amortized over the vesting term using an accelerated method. Restricted stock granted in 2009 to non-employee directors vests over a three-year period.
Recently Issued and/or Adopted Accounting Standards
Broad Transactions
Fair Value Measurements and Disclosures (Accounting Standards Codification “ASC 820”). On January 21, 2010, the FASB issued an accounting standard update, or ASU, Fair Value Measurements and Disclosures (Topic 820):
TWO HARBORS INVESTMENT CORP.
Notes to the Consolidated Financial Statements - (continued)
Improving Disclosures about Fair Value Measurements, which provides guidance on how investment assets and liabilities are to be valued and disclosed. Specifically, the amendment requires reporting entities to disclose: (i) the input and valuation techniques used to measure fair value for both recurring and nonrecurring fair value measurements, for Level 2 or Level 3 positions, (ii) transfers between all levels (including Level 1 and Level 2) on a gross basis (i.e., transfers out are disclosed separately from transfers in) as well as the reason(s) for the transfer and (iii) purchases, sales, issuances and settlements on a gross basis in the Level 3 rollforward, rather than as one net number. The effective date of the amendment is for interim and annual periods beginning after December 15, 2009; however, the requirement to provide the Level 3 activity for purchases, sales, issuances and settlements on a gross basis will be effective for interim and annual periods beginning after December 15, 2010. The impact of adopting this ASU did not have a material impact on the Company's consolidated financial condition or results of operations.
Note 3. Available-for-Sale Securities, at Fair Value
The following table presents the Company's available-for-sale, or AFS, investment securities by collateral type, which were carried at their fair value:
| | | | | | | |
(in thousands) | December 31,
2010 | | December 31,
2009 |
Mortgage-backed securities: | | | |
Agency | | | |
Federal Home Loan Mortgage Corporation | $ | 396,888 | | | $ | 255,669 | |
Federal National Mortgage Association | 556,609 | | | 155,729 | |
Government National Mortgage Association | 62,972 | | | 6,422 | |
Non-agency | 337,936 | | | 76,645 | |
Total mortgage-backed securities | $ | 1,354,405 | | | $ | 494,465 | |
At December 31, 2010 and December 31, 2009, the Company pledged investment securities with a carrying value of $1.1 billion and $0.4 billion, respectively, as collateral for repurchase agreements. See Note 9 - Repurchase Agreements.
At December 31, 2010 and December 31, 2009, the Company did not have any securities purchased from and financed with the same counterparty that did not meet the conditions of ASC 860, Transfers and Servicing, to be considered linked transactions and therefore classified as derivatives.
The following tables present the amortized cost and carrying value (which approximates fair value) of AFS securities by collateral type as of December 31, 2010 and December 31, 2009:
| | | | | | | | | | | |
| December 31, 2010 |
(in thousands) | Agency | | Non-Agency | | Total |
Face Value | $ | 1,306,655 | | | $ | 594,306 | | | $ | 1,900,961 | |
Unamortized premium | 41,651 | | | — | | | 41,651 | |
Unamortized discount | | | | | |
Designated credit reserve | — | | | (145,855 | ) | | (145,855 | ) |
Net, unamortized | (334,979 | ) | | (129,992 | ) | | (464,971 | ) |
Amortized Cost | 1,013,327 | | | 318,459 | | | 1,331,786 | |
Gross unrealized gains | 9,308 | | | 21,503 | | | 30,811 | |
Gross unrealized losses | (6,166 | ) | | (2,026 | ) | | (8,192 | ) |
Carrying Value | $ | 1,016,469 | | | $ | 337,936 | | | $ | 1,354,405 | |
TWO HARBORS INVESTMENT CORP.
Notes to the Consolidated Financial Statements - (continued)
| | | | | | | | | | | |
| December 31, 2009 |
(in thousands) | Agency | | Non-Agency | | Total |
Face Value | $ | 534,879 | | | $ | 166,581 | | | $ | 701,460 | |
Unamortized premium | 18,535 | | | — | | | 18,535 | |
Unamortized discount | | | | | | | | |
Designated credit reserve | — | | | (50,187 | ) | | (50,187 | ) |
Net, unamortized | (133,343 | ) | | (41,050 | ) | | (174,393 | ) |
Amortized Cost | 420,071 | | | 75,344 | | | 495,415 | |
Gross unrealized gains | 1,082 | | | 2,020 | | | 3,102 | |
Gross unrealized losses | (3,333 | ) | | (719 | ) | | (4,052 | ) |
Carrying Value | $ | 417,820 | | | $ | 76,645 | | | $ | 494,465 | |
The following tables present the carrying value of the Company's AFS investment securities by rate type as of December 31, 2010 and December 31, 2009:
| | | | | | | | | | | |
| December 31, 2010 |
(in thousands) | Agency | | Non-Agency | | Total |
Adjustable Rate | $ | 269,512 | | | $ | 245,517 | | | $ | 515,029 | |
Fixed Rate | 746,957 | | | 92,419 | | | 839,376 | |
Total | $ | 1,016,469 | | | $ | 337,936 | | | $ | 1,354,405 | |
| | | | | | | | | | | |
| December 31, 2009 |
(in thousands) | Agency | | Non-Agency | | Total |
Adjustable Rate | $ | 305,441 | | | $ | 34,849 | | | $ | 340,290 | |
Fixed Rate | 112,379 | | | 41,796 | | | 154,175 | |
Total | $ | 417,820 | | | $ | 76,645 | | | $ | 494,465 | |
When the Company purchases a credit-sensitive AFS security at a significant discount to its face value, the Company often does not amortize into income a significant portion of this discount that the Company is entitled to earn because it does not expect to collect it due to the inherent credit risk of the security. The Company may also record an other-than-temporary impairment, or OTTI, for a portion of its investment in the security to the extent the Company believes that principal losses will exceed the discount. The amount of principal that the Company does not amortize into income is designated as a credit reserve on the security, with net unamortized discounts or premiums amortized into income over time using the interest method in accordance with ASC 320.
The following table presents the changes for the year ended December 31, 2010 and December 31, 2009, respectively, of the unamortized net discount and designated credit reserves on non-Agency AFS securities.
TWO HARBORS INVESTMENT CORP.
Notes to the Consolidated Financial Statements - (continued)
| | | | | | | | | | | | | | | | | | | | | | | |
| December 31, 2010 | | December 31, 2009 |
(in thousands) | Designated credit reserve | | Unamortized net discount | | Total | | Designated credit reserve | | Unamortized net discount | | Total |
Beginning balance at January 1 | $ | (50,187 | ) | | $ | (41,050 | ) | | $ | (91,237 | ) | | $ | — | | | $ | — | | | $ | — | |
Acquisitions | (142,041 | ) | | (117,908 | ) | | (259,949 | ) | | (50,273 | ) | | (46,226 | ) | | (96,499 | ) |
Accretion of net discount | — | | | 10,850 | | | 10,850 | | | — | | | 623 | | | 623 | |
Realized credit losses | 1,736 | | | 8 | | | 1,744 | | | 86 | | | — | | | 86 | |
Transfers (to) from | 4,850 | | | (4,850 | ) | | — | | | — | | | — | | | — | |
Sales, calls, other | 39,787 | | | 22,958 | | | 62,745 | | | — | | | 4,553 | | | 4,553 | |
Ending balance at December 31 | $ | (145,855 | ) | | $ | (129,992 | ) | | $ | (275,847 | ) | | $ | (50,187 | ) | | $ | (41,050 | ) | | $ | (91,237 | ) |
The following table presents the components comprising the carrying value of AFS securities not deemed to be other than temporarily impaired by length of time the securities had an unrealized loss position as of December 31, 2010 and December 31, 2009. At December 31, 2010, the Company held 373 AFS securities, of which 108 were in an unrealized loss position for less than twelve consecutive months and 5 were in an unrealized loss position for more than twelve consecutive months. At December 31, 2009, the Company held 112 AFS securities, of which 61 were in an unrealized loss position for less than twelve months.
| | | | | | | | | | | | | | | | | | | | |
| Unrealized Loss Position for |
| Less than 12 Months | | 12 Months or More | Total |
(in thousands) | Estimated Fair Value | | Gross Unrealized Losses | | Estimated Fair Value | Gross Unrealized Losses | Estimated Fair Value | Gross Unrealized Losses |
December 31, 2010 | $ | 310,445 | | | $ | (7,183 | ) | | $ | 1,405 | | $ | (1,009 | ) | $ | 311,850 | | $ | (8,192 | ) |
December 31, 2009 | $ | 412,956 | | | $ | (4,052 | ) | | $ | — | | $ | — | | $ | 412,956 | | $ | (4,052 | ) |
Evaluating AFS Securities for Other-than-Temporary Impairments
In 2009, the Company adopted the provisions of ASC 320 to evaluate AFS securities for OTTI. This evaluation requires us to determine whether there has been a significant adverse quarterly change in the cash flow expectations for a security. The Company also considers whether there has been a significant adverse change in the regulatory and/or economic environment as part of this analysis. As of December 31, 2010, we did not intend to sell any of the Company's AFS securities in loss positions and the Company believes it is not more likely than not we will be required to sell these securities before recovery of their amortized cost basis. Based on the Company's evaluation, for the year ended December 31, 2010, the Company did not recognize any OTTIs on AFS securities in the Company's consolidated statements of income (loss).
Gross Realized Gains and Losses
Gains and losses from the sale of AFS securities are recorded as realized gains (losses) within gain on investment securities, net in the Company's consolidated statements of income (loss). For the year ended December 31, 2010, the Company sold AFS securities for $415.8 million with an amortized cost of $409.5 million, for a net realized gain of $6.3 million respectively, which included sales of U.S. Treasuries with an amortized cost of $295.8 million.
The following table presents the gross realized gains and losses on sales of AFS securities for the years ended December 31, 2010, 2009 and 2008:
| | | | | | | | | | | |
| Year Ended |
| December 31, |
(in thousands) | 2010 | | 2009 | | 2008 |
Gross realized gains | $ | 6,607 | | | $ | 336 | | | $ | — | |
Gross realized losses | (332 | ) | | — | | | — | |
Total realized gains (losses) on sales, net | $ | 6,275 | | | $ | 336 | | | $ | — | |
TWO HARBORS INVESTMENT CORP.
Notes to the Consolidated Financial Statements - (continued)
Note 4. Trading Securities, at Fair Value
During the year ended December 31, 2010, the Company acquired and sold a limited number of U.S. Treasuries in its taxable REIT subsidiary and classified these securities as trading instruments due to its short-term investment objectives. As of December 31, 2010, the Company held U.S. Treasuries with an amortized cost of $200.0 million and a fair value $199.5 million classified as trading securities. The Company did not hold any U.S. Treasuries classified as trading securities as of December 31, 2009.
For the year ended December 31, 2010, the Company sold trading securities with an amortized cost of $58.2 million resulting in realized gains of $0.3 million on the sale of these investment securities. The realized gains are recorded as a component of gains on investment securities, net in the Company's consolidated statement of income (loss).
At December 31, 2010, the Company pledged trading securities with a carrying value of $199.5 million as collateral for repurchase agreements. See Note 9 - Repurchase Agreements.
Note 5. Restricted Cash
As of December 31, 2010 and December 31, 2009, the Company is required to maintain certain cash balances with counterparties for broker activity and collateral for the Company's repurchase agreements in non-interest bearing accounts.
The following table presents the Company's restricted cash balances:
| | | | | | | |
(in thousands) | December 31,
2010 | | December 31,
2009 |
Restricted cash balances held by: | | | |
Broker counterparties for securities trading activity | $ | 9,000 | | | $ | 8,000 | |
Broker counterparties for derivatives trading activity | 1,914 | | | — | |
Repurchase counterparties as restricted collateral | 11,634 | | | 913 | |
Total | $ | 22,548 | | | $ | 8,913 | |
Note 6. Accrued Interest Receivable
The following table presents the Company's accrued interest receivable by collateral type:
| | | | | | | |
(in thousands) | December 31,
2010 | | December 31,
2009 |
Accrued Interest Receivable: | | | |
U.S. Treasuries | $ | 192 | | | $ | — | |
Mortgage-backed securities: | | | |
Agency | | | |
Federal Home Loan Mortgage Corporation | 1,509 | | | 1,228 | |
Federal National Mortgage Association | 2,201 | | | 809 | |
Government National Mortgage Association | 532 | | | 128 | |
Non-agency | 949 | | | 415 | |
Total mortgage-backed securities | 5,191 | | | 2,580 | |
Total | $ | 5,383 | | | $ | 2,580 | |
Note 7. Derivative Instruments and Hedging Activities
The Company enters into a variety of derivative and non-derivative instruments in connection with its risk management activities. The Company's primary objective for executing these derivatives and non-derivative instruments is to mitigate the Company's economic exposure to future events that are outside its control. The Company's derivative financial instruments are utilized principally to manage market risk and cash flow volatility associated with interest rate risk (including associated prepayment risk) related to certain assets and liabilities. As part of its risk management
TWO HARBORS INVESTMENT CORP.
Notes to the Consolidated Financial Statements - (continued)
activities, the Company may, at times, enter into various forward contracts including short securities, agency to-be-announced securities, or TBAs, options, futures, swaps and caps. In executing on the Company's current risk management strategy, the Company has entered into interest rate swap and swaption agreements and TBA positions. The Company has also entered into a number of non-derivative instruments to manage interest rate risk, principally U.S. Treasuries and Agency interest-only securities.
The following summarizes the Company's significant asset and liability classes, the risk exposure for these classes, and the Company's risk management activities used to mitigate certain of these risks. The discussion includes both derivative and non-derivative instruments used as part of these risk management activities. While the Company uses non-derivative and derivative instruments to achieve the Company's risk management activities, it is possible that these instruments will not effectively mitigate all or a substantial portion of the Company's market rate risk. In addition, the Company might elect, at times, not to enter into certain hedging arrangements in order to maintain compliance with REIT requirements.
Interest Rate Sensitive Assets/Liabilities
Available-for-sale Securities - The Company's RMBS investment securities are generally subject to change in value when mortgage rates decline or increase, depending on the type of investment. Rising mortgage rates generally result in a slowing of refinancing activity, which slows prepayments and results in an unexpected decline in the value of the Company's fixed-rate agency pools. To mitigate the impact of this risk, the Company maintains a portfolio of financial instruments, primarily fixed-rate interest-only securities, which increase in value when interest rates increase. In addition, the Company has initiated a limited number of TBA positions to further mitigate its exposure to increased prepayment speeds. The primary objective is to minimize the overall risk of loss in the value of the investment securities due to the change in fair value caused by interest rate changes and their interrelated impact on prepayments.
As of December 31, 2010 and December 31, 2009, the Company had outstanding fair value of $18.4 million and $16.5 million, respectively, of interest-only securities in place to economically hedge its investment securities. These interest-only securities are included in AFS securities, at fair value, in the consolidated balance sheets. The Company did not hold any long or short notional TBA positions as of December 31, 2010 and 2009.
Repurchase Agreements - The Company monitors its repurchase agreements, which are generally floating rate debt, in relationship to the rate profile of its investment securities. When it is cost effective to do so, the Company may enter into interest rate swap arrangements to align the interest rate composition of its investment securities and debt portfolios, specifically repurchase agreements with maturities of less than 6 months. Typically, the interest receivable terms (i.e., LIBOR) of the interest rate swaps match the terms of the underlying debt, resulting in an effective conversion of the rate of the related repurchase agreement from floating to fixed.
As of December 31, 2010 and December 31, 2009, the Company had the following outstanding interest rate swaps that were utilized as economic hedges of interest rate risk associated with the Company's short-term repurchase agreements:
| | | | | | | | | | | |
(notional in thousands) | | | | | | |
December 31, 2010 |
Swaps Maturities | | Notional Amounts | | Average Fixed Pay Rate | | Average Receive Rate | | Average Maturity (Years) |
2011 | | 100,000 | | | 1.168 | % | | 0.343 | % | | 0.96 |
2012 | | 25,000 | | | 0.868 | % | | 0.308 | % | | 1.98 |
2013 | | 175,000 | | | 1.376 | % | | 0.306 | % | | 2.61 |
2014 | | 175,000 | | | 1.671 | % | | 0.303 | % | | 3.96 |
2015 | | 175,000 | | | 1.830 | % | | 0.287 | % | | 4.84 |
Total | | 650,000 | | | | | | | |
| | | | | | | | | | | |
(notional in thousands) | | | | | | |
December 31, 2009 |
Swaps Maturities | | Notional Amount | | Average Fixed Pay Rate | | Average Receive Rate | | Average Maturity (Years) |
2011 | | 100,000 | | | 1.168 | % | | 0.254 | % | | 1.96 |
Total | | 100,000 | | | | | | | |
TWO HARBORS INVESTMENT CORP.
Notes to the Consolidated Financial Statements - (continued)
The Company has also entered into interest rate swaps in combination with U.S. Treasuries to economically hedge funding cost risk. As of December 31, 2010, the Company holds $199.5 million in fair value of U.S. Treasuries classified as trading securities and the following outstanding interest rate swaps:
| | | | | | | | | | | |
(notional in thousands) | | | | | | |
Swaps Maturities | | Notional Amounts | | Average Fixed Pay Rate | | Average Receive Rate | | Average Maturity (Years) |
2012 | | 200,000 | | | 0.557 | % | | 0.278 | % | | 1.80 |
Total | | 200,000 | | | | | | | |
All of the Company's interest rate swap contracts receive interest at a 1-month or 3-month LIBOR rate.
Additionally, as of December 31, 2010, the Company had the following outstanding interest rate swaptions (agreements to enter into interest rate swaps in the future for which the Company would pay a fixed rate) that were utilized as macro-economic hedges:
| | | | | | | | | | | | | | | | | | | | | |
(notional and dollars in thousands) | | Option | | Underlying Swap |
Swaption | | Cost | | Fair Value | | Average Months to Expiration | | Notional Amount | | Average Fixed Pay Rate | | Average Receive Rate | | Average Term (Years) |
Payer | | $ | 3,348 | | | $ | 4,028 | | | 11.23 | | 100,000 | | | 3.52 | % | | 3M Libor | | 8.5 | |
The Company has not applied hedge accounting to its current derivative portfolio held to mitigate the interest rate risk associated with its debt portfolio. As a result, the Company is subject to volatility in its earnings due to movement in the unrealized gains and losses associated with its interest rate swaps and its other derivative instruments.
Foreign Currency Risk
In compliance with the Company's REIT requirements, the Company does not have exposure to foreign denominated assets or liabilities. As such, the Company is not subject to foreign currency risk.
Non-Risk Management Activities
The Company has entered into certain financial instruments that are considered derivative contracts under ASC 815 that are not for purposes of hedging. These contracts are currently limited to inverse interest-only residential mortgage securities and credit default swaps.
Inverse interest-only securities with a carrying value of $30.9 million, including accrued interest receivable, are accounted for as derivative financial instruments in the consolidated financial statements. The following table presents the amortized cost and carrying value (which approximates fair value) of inverse interest-only securities as of December 31, 2010:
| | | |
(in thousands) | December 31, 2010 |
Face Value | $ | 219,459 | |
Unamortized premium | — | |
Unamortized discount | |
Designated credit reserve | — | |
Net, unamortized | (190,162 | ) |
Amortized Cost | 29,297 | |
Gross unrealized gains | 1,902 | |
Gross unrealized losses | (665 | ) |
Carrying Value | $ | 30,534 | |
TWO HARBORS INVESTMENT CORP.
Notes to the Consolidated Financial Statements - (continued)
The Company did not hold any inverse interest-only securities as of December 31, 2009.
As of December 31, 2010, the Company also holds credit default swaps where the Company provides credit protection for a fixed premium. The maximum payouts for these credit default swaps are limited to the current notional amounts of each swap contract. Maximum payouts for credit default swaps do not represent the expected future cash requirements, as the Company's credit default swaps are typically liquidated or expire and are not exercised by the holder of the credit default swaps.
The following table represents credit default swaps where the Company is providing protection held as of December 31, 2010:
| | | | | | | | | | | | | | | | | | |
(notional and dollars in thousands) | | | | | | | | |
Maturity Date | | Average Implied Credit Spread | | Current Notional Amount | | Fair Value | | Upfront Payable | | Unrealized Gain/(Loss) |
7/25/2036 | | 378.47 | | | 41,576 | | | $ | 3,137 | | | $ | (3,554 | ) | | $ | (417 | ) |
Credit Risk
The Company has limited its exposure to credit losses on its U.S. Treasuries and Agency portfolio of investment securities because these securities are issued by the U.S. Department of the Treasury or government sponsored entities, or GSEs. The payment of principal and interest on the FHLMC and FNMA mortgage-backed securities are guaranteed by those respective agencies, and the payment of principal and interest on the GNMA mortgage-backed securities are backed by the full faith and credit of the U.S. Government.
For non-Agency investment securities, the Company currently does not believe it is cost effective or beneficial to the Company's REIT status to hedge credit risk with derivative instruments, and accordingly, the Company does not hold derivative instruments to specifically hedge credit risk. However, the Company has processes and controls in place to monitor, analyze, manage and mitigate its credit risk with respect to non-Agency RMBS.
Derivative financial instruments contain an element of credit risk if counterparties are unable to meet the terms of the agreements. Credit risk associated with derivative financial instruments is measured as the net replacement cost should the counterparties that owe the Company under contracts completely fail to perform under the terms of these contracts, assuming there are no recoveries of underlying collateral, as measured by the market value of the derivative financial instruments. As of December 31, 2010, the fair value of derivative financial instruments as an asset and liability position was $38.1 million and $0.2 million, respectively.
The Company mitigates the credit risk exposure on derivative financial instruments by limiting the counterparties to those major banks and financial institutions that meet established credit guidelines, and the Company seeks to transact with several different counterparties in order to reduce the exposure to any single counterparty. Additionally, the Company reduces credit risk on the majority of its derivative instruments by entering into agreements that permit the closeout and netting of transactions with the same counterparty upon occurrence of certain events. To further mitigate the risk of counterparty default, the Company maintains collateral agreements with certain of its counterparties. The agreements require both parties to maintain cash deposits in the event the fair values of the derivative financial instruments exceed established thresholds. The Company has not received cash deposits from counterparties as of December 31, 2010. The Company has placed cash deposits of $3.6 million as of December 31, 2010 in accounts maintained by counterparties, of which the amounts are classified as restricted cash or due from counterparties on the consolidated balance sheet.
In accordance with ASC 815, as amended and interpreted, the Company records derivative financial instruments on its consolidated balance sheet as assets or liabilities at fair value. Changes in fair value are accounted for depending on the use of the derivative instruments and whether they qualify for hedge accounting treatment. Due to the volatility of the credit markets and difficulty in effectively matching pricing or cash flows, the Company has elected to treat all current derivative contracts as trading instruments.
Balance Sheet Presentation
The following tables represent the gross fair value and notional amounts of the Company's derivative financial instruments treated as trading instruments as of December 31, 2010 and December 31, 2009.
TWO HARBORS INVESTMENT CORP.
Notes to the Consolidated Financial Statements - (continued)
| | | | | | | | | | | | | | | | | | | | | | | | |
(in thousands) | | December 31, 2010 | | December 31, 2009 |
| | Derivative Assets | | Derivative Liabilities | | Derivative Assets | | Derivative Liabilities |
Trading instruments | | Fair Value | Notional | | Fair Value | Notional | | Fair Value | Notional | | Fair Value | Notional |
Inverse interest-only securities | | $ | 30,944 | | 219,459 | | | $ | — | | — | | | $ | — | | — | | | $ | — | | — | |
Interest rate swap agreements | | — | | — | | | (158 | ) | 850,000 | | | 364 | | 100,000 | | | — | | — | |
Credit default swap agreements | | 3,137 | | 75,000 | | | — | | — | | | — | | — | | | — | | — | |
Swaptions | | 4,028 | | 100,000 | | | — | | — | | | — | | — | | | — | | — | |
Total | | $ | 38,109 | | 394,459 | | | $ | (158 | ) | 850,000 | | | $ | 364 | | 100,000 | | | $ | — | | — | |
The following table provides the average monthly outstanding notional amounts of the Company's derivative financial instruments treated as trading instruments for the year ended December 31, 2010:
| | | | | | |
(in thousands) | | Year Ended December 31, 2010 |
Trading instruments | | Derivative Assets | | Derivative Liabilities |
Inverse interest-only securities | | 176,064 | | | — | |
TBAs | | 75,609 | | | 91,745 | |
Credit default swaps | | 16,101 | | | — | |
Swaptions | | 6,861 | | | — | |
Interest rate swap agreements | | — | | | 377,400 | |
Short treasuries | | — | | | 2,856 | |
Income Statement Presentation
The following table summarizes the location and amount of gains and losses on derivative instruments reported in the consolidated statement of income on its derivative instruments (in thousands).
| | | | | | | | | | | | | | |
Trading Instruments | | Location of Gain/(Loss) Recognized in Income on Derivatives | | Amount of Gain/(Loss) Recognized in Income on Derivatives |
| | | | Year Ended December 31, |
| | | | 2010 | | 2009 | | 2008 |
Risk Management Instruments | | | | | | | | |
Interest Rate Contracts | | | | | | | | |
Investment securities - RMBS | | Gain on other derivative instruments | | $ | 2,711 | | | $ | — | | | $ | — | |
Investment securities - U.S. Treasuries | | Gain (loss) on interest rate swap and swaption agreements | | (2,047 | ) | | — | | | — | |
Repurchase agreements | | Gain (loss) on interest rate swap and swaption agreements | | (4,297 | ) | | 364 | | | — | |
Non-Risk Management Instruments | | | | | | | | |
Credit default swaps | | Gain on other derivative instruments | | (44 | ) | | — | | | — | |
Inverse interest-only securities | | Gain on other derivative instruments | | 4,489 | | | — | | | — | |
Total | | | | $ | 812 | | | $ | 364 | | | $ | — | |
For the year ended December 31, 2010, the Company terminated a total of three notional swap positions of $250.0 million. Upon settlement of the early terminations, the Company paid $1.3 million in full settlement of its net interest spread liability and $4.4 million in realized losses on the swaps, including an early termination penalty.
Note 8. Fair Value
Fair Value Measurements
TWO HARBORS INVESTMENT CORP.
Notes to the Consolidated Financial Statements - (continued)
ASC 820 defines fair value as the price that would be received to sell an asset or paid to transfer a liability in an orderly transaction between market participants at the measurement date. ASC 820 clarifies that fair value should be based on the assumptions market participants would use when pricing an asset or liability and establishes a fair value hierarchy that prioritizes the information used to develop those assumptions. The fair value hierarchy gives the highest priority to quoted prices available in active markets (i.e., observable inputs) and the lowest priority to data lacking transparency (i.e., unobservable inputs). Additionally, ASC 820 requires an entity to consider all aspects of nonperformance risk, including the entity's own credit standing, when measuring fair value of a liability.
ASC 820 establishes a three level hierarchy to be used when measuring and disclosing fair value. An instrument's categorization within the fair value hierarchy is based on the lowest level of significant input to its valuation. Following is a description of the three levels:
| |
Level 1 | Inputs are quoted prices in active markets for identical assets or liabilities as of the measurement date. Additionally, the entity must have the ability to access the active market and the quoted prices cannot be adjusted by the entity. |
| |
Level 2 | Inputs include quoted prices in active markets for similar assets or liabilities; quoted prices in inactive markets for identical or similar assets or liabilities; or inputs that are observable or can be corroborated by observable market data by correlation or other means for substantially the full-term of the assets or liabilities. |
| |
Level 3 | Unobservable inputs are supported by little or no market activity. The unobservable inputs represent management's best assumptions of how market participants would price the assets and liabilities. Generally, Level 3 assets and liabilities are valued using pricing models, discounted cash flow methodologies, or similar techniques that require significant judgment or estimation. |
Following are descriptions of the valuation methodologies used to measure material assets and liabilities at fair value and details of the valuation models, key inputs to those models and significant assumptions utilized.
Investment securities - The Company holds a portfolio of available-for-sale and trading securities that are carried at fair value in the consolidated balance sheet. Available-for-sale securities are primarily comprised of Agency and non-Agency RMBS while the Company's U.S. Treasuries are classified as trading securities. The Company determines the fair value of its U.S. Treasuries and Agency RMBS based upon prices obtained from third-party pricing providers or broker quotes received using bid price, which are deemed indicative of market activity. In determining the fair value of its non-Agency RMBS, management judgment is used to arrive at fair value that considers prices obtained from third-party pricing providers, broker quotes received and other applicable market data. If observable market prices are not available or insufficient to determine fair value due to principally illiquidity in the marketplace, then fair value is based upon internally developed models that are primarily based on observable market-based inputs but also include unobservable market data inputs (including prepayment speeds, delinquency levels, and credit losses). The Company classified 100% of its U.S. Treasuries as Level 1 fair value assets at December 31, 2010. The Company classified 99.4% of its RMBS available for sale securities reported at fair value as Level 2 at December 31, 2010. Available-for-sale and trading securities account for 85.1% and 12.5% of all assets reported at fair value at December 31, 2010, respectively.
Derivative instruments - The Company may enter into a variety of derivative financial instruments as part of its hedging strategies. The Company principally executes over-the-counter, or OTC, derivative contracts, such as interest rate swaps. The Company utilizes internally developed models that are widely accepted in the market to value their over-the-counter derivative contracts. The specific terms of the contract are entered into the model, as well as market observable inputs such as interest rate forward curves and interpolated volatility assumptions. As all significant inputs into these models are market observable, the Company classified 100% of the interest rate swaps, swaptions and credit default swaps reported at fair value as Level 2 at December 31, 2010.
The Company also enters into certain other derivative financial instruments, such as TBAs and inverse interest-only securities. These instruments are similar in form to the Company's AFS securities and the Company utilizes broker quotes to value these instruments. The Company classified 100% of its inverse interest-only securities at fair value as Level 2 at December 31, 2010. The Company did not hold TBAs as of December 31, 2010.
The Company's Risk Management Committee governs trading activity relating to derivative instruments. The Company's policy is to minimize credit exposure related to financial derivatives used for hedging, by limiting the hedge counterparties to major banks, financial institutions, exchanges, and private investors who meet established capital and credit guidelines, as well as by limiting the amount of exposure to any individual counterparty.
TWO HARBORS INVESTMENT CORP.
Notes to the Consolidated Financial Statements - (continued)
The Company has netting arrangements in place with all derivative counterparties pursuant to standard documentation developed by the International Swap and Derivatives Association, or ISDA. Additionally, both the Company and the counterparty are required to post cash collateral based upon the net underlying market value of the Company's open positions with the counterparty. Posting of cash collateral typically occurs daily, subject to certain dollar thresholds. Due to the existence of netting arrangements, as well as frequent cash collateral posting at low posting thresholds, credit exposure to the Company and/or to the counterparty is considered materially mitigated and based on the Company's assessment, there is no requirement for any additional adjustment to derivative valuations specifically for credit.
Recurring Fair Value
The following tables display the Company's assets and liabilities measured at fair value on a recurring basis. The Company often economically hedges the fair value change of its assets or liabilities with derivatives and other financial instruments. The tables below display the hedges separately from the hedged items, and therefore do not directly display the impact of the Company's risk management activities.
| | | | | | | | | | | | | | | |
| Recurring Fair Value Measurements |
| At December 31, 2010 |
(in thousands) | Level 1 | | Level 2 | | Level 3 | | Total |
Assets | | | | | | | |
Available-for-sale securities | $ | — | | | $ | 1,345,805 | | | $ | 8,600 | | | $ | 1,354,405 | |
Trading securities | 199,523 | | | — | | | — | | | 199,523 | |
Derivative assets | — | | | 38,109 | | | — | | | 38,109 | |
Total assets | $ | 199,523 | | | $ | 1,383,914 | | | $ | 8,600 | | | $ | 1,592,037 | |
Liabilities | | | | | | | |
Derivative liabilities | $ | — | | | $ | 158 | | | $ | — | | | $ | 158 | |
Total liabilities | $ | — | | | $ | 158 | | | $ | — | | | $ | 158 | |
| | | | | | | | | | | | | | | |
| Recurring Fair Value Measurements |
| At December 31, 2009 |
(in thousands) | Level 1 | | Level 2 | | Level 3 | | Total |
Assets | | | | | | | |
Available-for-sale securities | $ | — | | | $ | 492,339 | | | $ | 2,126 | | | $ | 494,465 | |
Trading securities | — | | | — | | | — | | | — | |
Derivative assets | — | | | 364 | | | — | | | 364 | |
Total assets | $ | — | | | $ | 492,703 | | | $ | 2,126 | | | $ | 494,829 | |
Liabilities | | | | | | | |
Derivative liabilities | $ | — | | | $ | — | | | $ | — | | | $ | — | |
Total liabilities | $ | — | | | $ | — | | | $ | — | | | $ | — | |
The valuation of Level 3 instruments requires significant judgment by the third-party pricing providers and/or management. The third party pricing providers and/or management rely on inputs such as market price quotations from market makers (either market or indicative levels), original transaction price, recent transactions in the same or similar instruments, and changes in financial ratios or cash flows to determine fair value. Level 3 instruments may also be discounted to reflect illiquidity and/or non-transferability, with the amount of such discount estimated by the third party pricing provider in the absence of market information. Assumptions used by the third party pricing provider due to lack of observable inputs may significantly impact the resulting fair value and therefore the Company's financial statements. The Company's valuation committee reviews all valuations that are based on pricing information received from a third party pricing provider. As part of this review, prices are compared against other pricing or input data points in the marketplace, along with internal valuation expertise, to ensure the pricing is reasonable. In addition, the Company performs back-testing of pricing information to validate price information and identify any pricing trends of a third party price provider.
TWO HARBORS INVESTMENT CORP.
Notes to the Consolidated Financial Statements - (continued)
In determining fair value, third party pricing providers use various valuation approaches, including market and income approaches. Inputs that are used in determining fair value of an instrument may include pricing information, credit data, volatility statistics, and other factors. In addition, inputs can be either observable or unobservable.
The availability of observable inputs can vary by instrument and is affected by a wide variety of factors, including the type of instrument, whether the instrument is new and not yet established in the marketplace and other characteristics particular to the instrument. The third party pricing provider uses prices and inputs that are current as of the measurement date, including during periods of market dislocations. In periods of market dislocation, the availability of prices and inputs may be reduced for many instruments. This condition could cause an instrument to be reclassified to or from various levels within the fair value hierarchy.
Securities for which market quotations are readily available are valued at the bid price (in the case of long positions) or the ask price (in the case of short positions) at the close of trading on the date as of which value is determined. Exchange-traded securities for which no bid or ask price is available are valued at the last traded price.
OTC derivative contracts, including interest rate swaps, are valued by the Company using observable inputs, such as quotations received from the counterparty, dealers or brokers, whenever available and considered reliable. In instances where models are used, the value of an OTC derivative depends upon the contractual terms of, and specific risks inherent in, the instrument as well as the availability and reliability of observable inputs. Such inputs include market prices for reference securities, yield curves, credit curves, volatility measures, prepayment rates and correlation of such inputs. Certain OTC derivatives, such as swaps, have inputs which can generally be corroborated by market data and are therefore classified within Level 2.
The tables below present the reconciliation for all of the Company's Level 3 assets and liabilities measured at fair value on a recurring basis. The Level 3 items presented below may be hedged by derivatives and other financial instruments that are classified as Level 1 or Level 2. Thus, the tables below do not fully reflect the impact of the Company's risk management activities.
| | | | | | | | | | | | | | | | | | | | | | | | | | | | | | | |
| Level 3 Recurring Fair Value Measurements |
| Year Ended December 31, 2010 |
| | | Total Net Gains/(Losses) Included in Net Income | | | | | | | | | | |
(in thousands) | Beginning of Period Level 3 Fair Value | | Realized Gains (Losses) | | Unrealized Gains (Losses) | | Other Comprehensive Income | | Purchases, Sales and Settlements, Net | | Gross Transfers Into Level 3 | | Gross Transfers Out of Level 3 | | End of Period Level 3 Fair Value |
Assets | | | | | | | | | | | | | | | |
Available-for-sale securities | $ | 2,126 | | | $ | (673 | ) | | $ | — | | | $ | 125 | | (a) | $ | — | | | $ | 14,124 | | | $ | (7,102 | ) | | $ | 8,600 | |
Derivative assets | — | | | (7 | ) | | (17 | ) | | — | | | 1,667 | | | — | | | (1,643 | ) | | — | |
Total assets | $ | 2,126 | | | $ | (680 | ) | | $ | (17 | ) | | $ | 125 | | | $ | 1,667 | | | $ | 14,124 | | | $ | (8,745 | ) | | $ | 8,600 | |
| | | | | | | | | | | | | | | | | | | | | | | | | | | | | | |
| Level 3 Recurring Fair Value Measurements |
| Year Ended December 31, 2009 |
| | | Total Net Gains/(Losses) Included in Net Income | | | | | | | | | | |
(in thousands) | Beginning of Period Level 3 Fair Value | | Realized Gains (Losses) | | Unrealized Gains (Losses) | | Other Comprehensive Income | | Purchases, Sales and Settlements, Net | | Gross Transfers Into Level 3 | | Gross Transfers Out of Level 3 | | End of Period Level 3 Fair Value |
Assets | | | | | | | | | | | | | | | |
Available-for-sale securities | $ | — | | | $ | (10 | ) | | $ | — | | | $ | (19 | ) | (a) | $ | 2,155 | | | — | | | $ | — | | | 2,126 | |
Derivative assets | — | | | — | | | — | | | — | | | — | | | — | | | — | | | — | |
Total assets | $ | — | | | $ | (10 | ) | | $ | — | | | $ | (19 | ) | | $ | 2,155 | | | — | | | $ | — | | | $ | 2,126 | |
____________________
(a) Change in unrealized gains (losses) on available-for-sale securities recorded in equity as accumulated other
TWO HARBORS INVESTMENT CORP.
Notes to the Consolidated Financial Statements - (continued)
comprehensive (loss) income.
The Company did not incur transfers between Level 1 and Level 2 for the year ended December 31, 2010. The Company did incur a minimal amount of transfer activity from Level 2 to Level 3 during the year ended December 31, 2010 as a result of the unavailability of third-party broker prices for the respective security and lack of qualitative and quantitative support for the liquidity of the instrument. Transfers between Levels are deemed to take place on the first day of the reporting period in which the transfer has taken place.
Nonrecurring Fair Value
The Company may be required to measure certain assets or liabilities at fair value from time to time. These periodic fair value measures typically result from application of certain impairment measures under GAAP. These items would constitute nonrecurring fair value measures under ASC 820. As of December 31, 2010, the Company did not have any assets or liabilities measured at fair value on a nonrecurring basis.
Fair Value of Financial Instruments
In accordance with ASC 820, the Company is required to disclose the fair value of financial instruments, both assets and liabilities recognized and not recognized in the consolidated balance sheet, for which fair value can be estimated.
The following describes the Company's methods for estimating the fair value for financial instruments. Descriptions are not provided for those items that have zero balances as of the current balance sheet date.
| |
• | Available-for-sale securities, trading securities, derivative assets and liabilities are recurring fair value measurements; carrying value equals fair value. See discussion of valuation methods and assumptions within the Fair Value Measurements section of this footnote. |
| |
• | Cash and cash equivalents and restricted cash have a carrying value which approximates fair value because of the short maturities of these instruments. |
| |
• | The carrying value of repurchase agreements approximates fair value due to the maturities of less than one year of these financial instruments. The Company's repurchase agreements have floating rates based on an index plus a spread. These borrowings have been recently entered into and the credit spread is typically consistent with those demanded in the market. Accordingly, the interest rates on these borrowings are at market and thus carrying value approximates fair value. |
Note 9. Repurchase Agreements
The Company had outstanding $1.2 billion of repurchase agreements, including repurchase agreements funding the Company's U.S. Treasuries of $198.8 million. Excluding the debt associated with the Company's U.S. Treasuries and the effect of the Company's interest rate swaps, the repurchase agreements had a weighted average borrowing rate of 0.74% and weighted average remaining maturities of 90 days as of December 31, 2010. The Company had outstanding $411.9 million of repurchase agreements with a weighted average borrowing rate of 0.4% excluding the effect of the Company's interest rate swaps, and weighted average remaining maturities of 90 days as of December 31, 2009. The debt associated with the Company's U.S. Treasuries had a weighted borrowing rate of 0.28%.
At December 31, 2010 and December 31, 2009, the repurchase agreements had the following characteristics:
| | | | | | | | | | | | | | |
(dollars in thousands) | | December 31, 2010 | | December 31, 2009 |
Collateral Type | | Amount Outstanding | | Weighted Average Borrowing Rate | | Amount Outstanding | | Weighted Average Borrowing Rate |
U.S. treasuries | | $ | 198,750 | | | 0.28 | % | | $ | — | | | — | |
Agency RMBS | | 745,861 | | | 0.37 | % | | 395,642 | | | 0.37 | % |
Non-Agency RMBS | | 201,976 | | | 2.05 | % | | 16,251 | | | 1.94 | % |
Agency derivatives | | 23,216 | | | 1.07 | % | | — | | | — | |
Total | | $ | 1,169,803 | | | 0.66 | % | | $ | 411,893 | | | 0.43 | % |
As of December 31, 2010, the Company's amounts outstanding under repurchase agreements includes $70.8 million of borrowings under the 364-day repurchase facility with Wells Fargo Bank National Association, or Wells Fargo. The facility provides an aggregate maximum borrowing capacity of $75 million and it is set to mature on August 3, 2011, unless extended pursuant to its terms. The facility is collateralized by non-Agency RMBS and its weighted average
TWO HARBORS INVESTMENT CORP.
Notes to the Consolidated Financial Statements - (continued)
borrowing rate as of December 31, 2010 was 1.98%. The facility also subjects the Company to maintain certain financial covenants under the guaranty agreement with Wells Fargo. As of December 31, 2010, the Company is in compliance with these covenants.
At December 31, 2010 and December 31, 2009, the repurchase agreements had the following remaining maturities:
| | | | | | | |
(in thousands) | December 31,
2010 | | December 31,
2009 |
Within 30 days | $ | 197,286 | | | $ | 207,050 | |
30 to 59 days | 211,556 | | | — | |
60 to 89 days | 117,621 | | | — | |
90 to 119 days | 152,433 | | | — | |
Over 120 days (1) | 292,157 | | | 204,842 | |
Open maturity (2) | 198,750 | | | — | |
Total | $ | 1,169,803 | | | $ | 411,892 | |
____________________
| |
(1) | Over 120 days includes the amounts outstanding under the Wells Fargo 364-day borrowing facility. |
| |
(2) | Repurchase agreements collateralized by U.S. Treasuries include an open maturity period (i.e., rolling 1-day maturity) renewable at the discretion of either party to the agreements. |
The following table summarizes assets at carrying value that are pledged or restricted as collateral for the future payment obligations of repurchase agreements:
| | | | | | | |
(in thousands) | December 31,
2010 | | December 31,
2009 |
Available-for-sale securities, at fair value | $ | 1,090,598 | | | $ | 444,833 | |
Trading securities, at fair value | 199,523 | | | — | |
Cash and cash equivalents | 14,467 | | | — | |
Restricted cash | 11,634 | | | 913 | |
Due from counterparties | 10,508 | | | 1,737 | |
Derivative assets, at fair value | 30,534 | | | — | |
Total | $ | 1,357,264 | | | $ | 447,483 | |
Although the repurchase agreements are committed borrowings until maturity, the respective lender retains the right to mark the underlying collateral to fair value. A reduction in the value of pledged assets would require the Company to provide additional collateral or fund margin calls.
The following table summarizes certain characteristics of the Company's repurchase agreements and counterparty concentration at December 31, 2010 and December 31, 2009:
| | | | | | | | | | | | | | | | | | | | | |
| December 31, 2010 | | December 31, 2009 |
(dollars in thousands) | Amount Outstanding | | Net Counterparty Exposure(1) | | Percent of Equity | | Amount Outstanding | | Net Counterparty Exposure(1) | | Percent of Equity |
Barclays Capital Inc. | $ | 168,291 | | | $ | 45,060 | | | 12 | % | | $ | 233,480 | | | $ | 17,283 | | | 14 | % |
All other counterparties | 1,001,512 | | | 132,125 | | | 35 | % | | 178,412 | | | 20,474 | | | 17 | % |
Total | $ | 1,169,803 | | | $ | 177,185 | | | | | $ | 411,892 | | | $ | 37,757 | | | |
____________________
(1) Represents the net carrying value of the securities sold under agreements to repurchase, including accrued interest plus any cash or assets on deposit to secure the repurchase obligation, over the amount of the repurchase liability, including accrued interest. At December 31, 2010, the Company had $231.7 million in payables due to broker counterparties for unsettled security purchases. The payables are not included in the amounts presented above.
TWO HARBORS INVESTMENT CORP.
Notes to the Consolidated Financial Statements - (continued)
The Company does not anticipate any defaults by its repurchase agreement counterparties.
Note 10. Other Assets
Other assets as of December 31, 2010 and 2009 are summarized in the following table:
| | | | | | | |
(in thousands) | December 31, | | December 31, |
| 2010 | | 2009 |
Prepaid expenses | $ | 706 | | | $ | 572 | |
Deferred tax assets | 554 | | | — | |
Prepaid tax asset | — | | | 490 | |
Total other assets | $ | 1,260 | | | $ | 1,062 | |
Note 11. Other Liabilities
Other liabilities as of December 31, 2010 and 2009 are summarized in the following table:
| | | | | | | |
(in thousands) | December 31, | | December 31, |
| 2010 | | 2009 |
Derivative liabilities, at fair value | $ | 158 | | | $ | — | |
Deferred tax liabilities | — | | | 124 | |
Income taxes payable | 1 | | | — | |
Total other liabilities | $ | 159 | | | $ | 124 | |
Note 12. Commitments and Contingencies
The following represent the material commitments and contingencies of the Company as of December 31, 2010:
Management agreement - The Company pays PRCM Advisers LLC a management fee equal to 1.5% per annum, calculated and payable quarterly in arrears, of the Company's stockholders' equity. For purposes of calculating the management fee, the Company's stockholders' equity means the sum of the net proceeds from all issuances of the Company's equity securities since inception (allocated on a pro rata daily basis for such issuances during the fiscal quarter of any such issuance), plus the Company's retained earnings at the end of the most recently completed calendar quarter (without taking into account any non-cash equity compensation expense incurred in current or prior periods), less any amount that the Company pays for repurchases of the Company's common stock since inception, and excluding any unrealized gains, losses or other items that do not affect realized net income (regardless of whether such items are included in other comprehensive income or loss, or in net income). This amount will be adjusted to exclude one-time events pursuant to changes in GAAP, and certain non-cash items after discussions between PRCM Advisers LLC and the Company's independent directors and approval by a majority of the Company's independent directors. To the extent asset impairment reduces the Company's retained earnings at the end of any completed calendar quarter; it will reduce the management fee for such quarter. The Company's stockholders' equity for the purposes of calculating the management fee could be greater than the amount of stockholders' equity shown on the consolidated financial statements. The initial term of the management agreement expires on October 28, 2012, with automatic, one-year renewals at the end of the initial term and each year thereafter.
The Company reimburses PRCM Advisers LLC for (i) the Company's allocable share of the compensation paid by PRCM Advisers LLC to its personnel serving as the Company's principal financial officer and general counsel and personnel employed by PRCM Advisers LLC as in-house legal, tax, accounting, consulting, auditing, administrative, information technology, valuation, computer programming and development and back-office resources to the Company, and (ii) any amounts for personnel of PRCM Advisers LLC's affiliates arising under a shared facilities and services agreement.
Upon termination of the management agreement by the Company without cause or by PRCM Advisers LLC due to
TWO HARBORS INVESTMENT CORP.
Notes to the Consolidated Financial Statements - (continued)
the Company's material breach of the management agreement, the Company is required to pay a termination fee equal to three times the sum of the average annual base management fee earned by PRCM Advisers LLC during the 24-month period immediately preceding the date of termination, calculated as of the end of the most recently completed fiscal quarter prior to the date of termination.
Contingent liabilities - As of December 31, 2009, certain fees payable pursuant to underwriting, legal and financial advisory arrangements entered into by the Company were deferred in lieu of certain rights to participate in future securities offerings by the Company. These fees were contingent on a future securities offering and were not recognized as a liability in the financial statements. As of December 31, 2010, the Company has fully satisfied these contingent obligations.
Operating leases and employment contracts - The Company does not currently maintain an office or directly employ personnel. Instead the Company relies on the facilities and resources of PRCM Advisers LLC to conduct the Company's operations. Expense reimbursements to PRCM Advisers LLC are made in cash on a quarterly basis following the end of each quarter.
Legal and regulatory - From time to time, the Company is subject to potential liability under laws and government regulations and various claims and legal actions arising in the ordinary course of business. Liabilities are established for legal claims when payments associated with the claims become probable and the costs can be reasonably estimated. The actual costs of resolving legal claims may be substantially higher or lower than the amounts established for those claims. Based on information currently available, management is not aware of any legal or regulatory claims that would have a material effect on the Company's consolidated financial statements and therefore no accrual is required as of December 31, 2010.
Note 13. Stockholders' Equity
Common stock
As of December 31, 2010, the Company had 40,501,212 shares of common stock outstanding and 33,249,000 warrants outstanding. The warrants, which can be converted into a share of common stock on a one-for-one basis, had an exercise price of $11.00 per share and expire on November 7, 2013. The warrant agreement limits a holder's ability to exercise warrants to ensure that such holder's beneficial ownership or constructive ownership (as defined in our charter) does not exceed the restrictions contained in the charter limiting the ownership of shares of our common stock for purposes of maintaining our REIT qualification.
A reconciliation of the common shares outstanding from inception through December 31, 2010 is as follows:
| | |
| Number of common shares |
Common shares | 24,936,558 | |
Capitol's common shares subject to conversion | 7,874,699 | |
Common shares outstanding, January 1, 2009 | 32,811,257 | |
Initial capital issuance from formation | — | |
Cancellation of Capitol Founders' shares | (6,562,257 | ) |
Common shares converted to cash | (6,875,130 | ) |
Common shares acquired by Capitol | (5,994,661 | ) |
Issuance of restricted stock (1) | 22,159 | |
Common shares outstanding, December 31, 2009 | 13,401,368 | |
Issuance of common stock | 27,063,381 | |
Issuance of restricted stock (1) | 36,463 | |
Common shares outstanding, December 31, 2010 | 40,501,212 | |
____________________
| |
(1) | Represents shares of restricted stock granted under the 2009 equity incentive plan, of which 51,235 restricted shares remain subject to vesting requirements. |
Distributions to stockholders
On December 8, 2010, the Company declared dividends to common stockholders totaling $10.5 million, or $0.40 per
TWO HARBORS INVESTMENT CORP.
Notes to the Consolidated Financial Statements - (continued)
share. The following table presents cash dividends declared by the Company on its common stock from October 28, 2009 through December 31, 2010:
| | | | | | | | |
Declaration Date | | Record Date | | Payment Date | | Cash Dividend Per Share |
December 8, 2010 | | December 17, 2010 | | January 20, 2011 | | $ | 0.40 | |
September 13, 2010 | | September 30, 2010 | | October 21, 2010 | | $ | 0.39 | |
June 14, 2010 | | June 30, 2010 | | July 22, 2010 | | $ | 0.33 | |
March 12, 2010 | | March 31, 2010 | | April 23, 2010 | | $ | 0.36 | |
December 21, 2009 | | December 31, 2009 | | January 26, 2010 | | $ | 0.26 | |
The Company's dividends declared in 2010 and 2009 are characterized as ordinary dividends.
Accumulated Other Comprehensive Income (Loss)
Accumulated other comprehensive income (loss) at December 31, 2010 and December 31, 2009 was as follows:
| | | | | | | |
(in thousands) | December 31,
2010 | | December 31,
2009 |
Available-for-sale securities, at fair value | | | |
Unrealized gains | $ | 30,811 | | | $ | 3,102 | |
Unrealized losses | (8,192 | ) | | (4,052 | ) |
Accumulated other comprehensive income (loss) | $ | 22,619 | | | $ | (950 | ) |
Public offerings
On April 26, 2010, the Company completed a public offering of 11,500,000 shares of its common stock and subsequently issued an additional 1,188,381 shares of common stock pursuant to the underwriters' over-allotments at a price of $8.90 per share, for gross proceeds of approximately $113.0 million. On December 22, 2010, the Company completed a follow-on public offering of 12,500,000 shares of its common stock and subsequently issued an additional 1,875,000 shares of common stock pursuant to the underwriters' over-allotments at a price of $9.35 per share, for gross proceeds of approximately $134.4 million. Net proceeds to the Company from the offerings were approximately $235.3 million, net of issuance costs of approximately $12.1 million.
Dividend Reinvestment and Direct Stock Purchase Plan
The Company sponsors a dividend reinvestment and direct stock purchase plan through which stockholders may purchase additional shares of the Company's common stock by reinvesting some or all of the cash dividends received on shares of the Company's common stock. Stockholders may also make optional cash purchases of shares of the Company's common stock subject to certain limitation detailed in the plan prospectus. An aggregate of 7.5 million shares of our common stock has been reserved for issuance under the plan. As of December 31, 2010, no shares have been issued under the plan.
Note 14. Equity Incentive Plan
In 2009, the Company adopted an equity incentive plan which provides incentive compensation to attract and retain qualified directors, officers, advisors, consultants and other personnel, including PRCM Advisers LLC and affiliates and personnel of PRCM Advisers LLC and its affiliates, and any joint venture affiliates of the Company.
The 2009 equity incentive plan is administered by the compensation committee. The compensation committee of the Company's board of directors, has the full authority to administer and interpret the 2009 equity incentive plan, to authorize the granting of awards, to determine the eligibility of directors, officers, advisors, consultants and other personnel, including PRCM Advisers LLC and affiliates and personnel of PRCM Advisers LLC and its affiliates, and any joint venture affiliates of the Company, to receive an award, to determine the number of shares of common stock to be covered by each award (subject to the individual participant limitations provided in the 2009 equity incentive plan), to determine the terms, provisions and conditions of each award (which may not be inconsistent with the terms of the 2009 equity incentive plan), to prescribe the form of instruments evidencing awards and to take any other actions and make all other
TWO HARBORS INVESTMENT CORP.
Notes to the Consolidated Financial Statements - (continued)
determinations that it deems necessary or appropriate in connection with the 2009 equity incentive plan or the administration or interpretation thereof. In connection with this authority, the compensation committee may, among other things, establish performance goals that must be met in order for awards to be granted or to vest, or for the restrictions on any such awards to lapse.
The Company's 2009 equity incentive plan provides for grants of restricted common stock, phantom shares, dividend equivalent rights and other equity-based awards, subject to a ceiling of 200,000 shares available for issuance under the plan. The plan allows for the Company's board of directors to expand the types of awards available under the plan to include long-term incentive plan (“LTIP”) units in the future. The maximum number of shares that may underlie awards in any one year to any eligible person may not exceed 100,000. If an award granted under the 2009 equity incentive plan expires or terminates, the shares subject to any portion of the award that expires or terminates without having been exercised or paid, as the case may be, will again become available for the issuance of additional awards. Unless previously terminated by the Company's board of directors, no new award may be granted under the 2009 equity incentive plan after the tenth anniversary of the date that such plan was initially approved by the Company's board of directors. No award may be granted under the Company's 2009 equity incentive plan to any person who, assuming payment of all awards held by such person, would own or be deemed to own more than 9.8% of the outstanding shares of the Company's common stock.
On October 28, 2009 and June 14, 2010, the Company granted 22,159 and 36,463 shares of restricted common stock, respectively, to its independent directors pursuant to the 2009 equity incentive plan. The estimated fair value of these awards was $9.59 and $8.57 per share, respectively, based on the closing price of the Company's common stock on such date. The grants will vest in three annual installments commencing on the date of the grant, as long as such director is serving as a board member on the vesting date.
| | | | | | | | | | | | | |
| 2010 | | 2009 |
| Shares | | Weighted Average Grant Date Fair Market Value | | Shares | | Weighted Average Grant Date Fair Market Value |
Outstanding at Beginning of Period | 22,159 | | | $ | 9.59 | | | — | | | $ | — | |
Granted | 36,463 | | | 8.57 | | | 22,159 | | | 9.59 | |
Vested | (7,387 | ) | | (9.59 | ) | | — | | | — | |
Forfeited | — | | | — | | | — | | | — | |
Outstanding at End of Period | 51,235 | | | $ | 8.86 | | | 22,159 | | | $ | 9.59 | |
For the years ended December 31, 2009 and December 31, 2010, the Company recognized compensation costs related to restricted stock of $21,644 and $213,545, respectively.
Note 15. Operating Expenses
Components of the Company's operating expenses for the years ended December 31, 2010, 2009 and 2008 are presented in the following table:
| | | | | | | | | | | |
| Year Ended December 31, |
| 2010 | | 2009 | | 2008 |
Costs associated with business combination | $ | — | | | $ | 9,572 | | | $ | — | |
Costs associated with Capitol as a development stage company | — | | | 1,347 | | | 1,060 | |
Other operating expenses: | | | | | |
General and administrative | 3,076 | | | 472 | | | — | |
Directors and officers' insurance | 424 | | | 155 | | | — | |
Professional fees | 1,078 | | | 625 | | | — | |
Total operating expenses | $ | 4,578 | | | $ | 12,171 | | | $ | 1,060 | |
GAAP requires the direct costs of a business combination, such as transaction fees, due diligence, and consulting services to no longer be included in the measurement of the business acquired. Instead, these direct costs were recognized as expenses
TWO HARBORS INVESTMENT CORP.
Notes to the Consolidated Financial Statements - (continued)
for the period in which they were incurred and the services received.
Note 16. Income Taxes
For the years ended December 31, 2010 and 2009, the Company qualified to be taxed as a REIT under the Code for U.S. federal income tax purposes. So long as the Company qualifies as a REIT, the Company generally will not be subject to U.S. federal income taxes on its taxable income to the extent it annually distributes its net taxable income to stockholders and maintains its intended qualification as a REIT. The majority of states also recognize the Company's REIT status. The Company currently intends to distribute 100% of its REIT taxable income and comply with all its requirements to continue to qualify as a REIT.
The following table summarizes the tax (benefit) provision for the years ended December 31, 2010, 2009 and 2008:
| | | | | | | | | | | | |
| | Year Ended December 31, |
(in thousands) | | 2010 | | 2009 | | 2008 |
Current tax (benefit) provision: | | | | | | |
Federal | | $ | (5 | ) | | $ | (442 | ) | | $ | 1,088 | |
State | | — | | | — | | | — | |
Total current tax (benefit) provision | | (5 | ) | | (442 | ) | | 1,088 | |
Deferred tax provision (benefit): | | | | | | |
Taxable subsidiaries | | (678 | ) | | 124 | | | — | |
Total deferred tax provision (benefit) | | (678 | ) | | 124 | | | — | |
Total (benefit from) provision for income taxes | | $ | (683 | ) | | $ | (318 | ) | | $ | 1,088 | |
The Company's taxable income before dividend distributions differed from our GAAP net (loss) income primarily due to the accounting for projected credit losses in our GAAP recognition of secondary market discount accretion income not recognized for tax, amortization of original issue discount on our Agency RMBS, unrealized gains and losses recognized in income not recognized for tax, a portion of the proceeds acquired in the merger transaction with Capitol which were treated as dividends of earnings in 2009, and the non-deductible expenses associated with the merger transaction that were treated as an adjustment to capital for tax purposes in 2009.
The following is a reconciliation of the statutory federal and state rates to the effective rates, for the years ended December 31, 2010, 2009 and 2008:
| | | | | | | | | | | | | | | | | | | | | |
| | Year Ended December 31, |
| | 2010 | | 2009 | | 2008 |
(dollars in thousands) | | Amount | | Percent | | Amount | | Percent | | Amount | | Percent |
Computed income tax expense at federal rate | | $ | 11,924 | | | 34 | % | | $ | (3,081 | ) | | (34 | )% | | $ | 1,150 | | | 34 | % |
State taxes, net of federal benefit, if applicable | | — | | | — | % | | — | | | — | % | | — | | | — | % |
Differences in taxable income from GAAP income (loss) | | (5 | ) | | — | % | | 4,012 | | | 44 | % | | (62 | ) | | (2 | )% |
Dividends paid deduction | | (12,602 | ) | | (36 | )% | | (1,249 | ) | | (14 | )% | | — | | | — | % |
Effective Tax Rate | | $ | (683 | ) | | (2 | )% | | $ | (318 | ) | | (4 | )% | | $ | 1,088 | | | 32 | % |
The Company's consolidated balance sheet, as of December 31, 2010 and 2009, contains the following current and deferred tax assets and liabilities:
TWO HARBORS INVESTMENT CORP.
Notes to the Consolidated Financial Statements - (continued)
| | | | | | | | |
(in thousands) | | December 31, 2010 | | December 31, 2009 |
Current tax | | | | |
Federal income tax (payable) prepaid | | $ | (1 | ) | | $ | 490 | |
State and local income tax payable | | — | | | — | |
Deferred tax assets (liabilities) | | 554 | | | (124 | ) |
| | $ | 553 | | | $ | 366 | |
Deferred Tax Assets and Liabilities
Deferred income taxes reflect the net tax effect of temporary differences between the carrying amount of assets and liabilities for financial reporting and tax purposes. Components of the Company's deferred tax assets and liabilities as of December 31, 2010 and 2009 are as follows:
| | | | | | | | |
| | December 31, |
(in thousands) | | 2010 | | 2009 |
Unrealized gain (loss) on derivative assets | | $ | 392 | | | $ | (124 | ) |
Unrealized loss on trading securities | | 162 | | | — | |
Total net deferred tax assets (liabilities) | | $ | 554 | | | $ | (124 | ) |
The Company did not hold deferred tax assets or liabilities as of December 31, 2008.
At December 31, 2010, the Company has not recorded a valuation allowance for any portion of its deferred tax assets as it does not believe, at a more likely than not level, that any portion of its deferred tax assets will not be realized. The Company estimates, based on existence of sufficient evidence, the ability to realize the remainder of its deferred tax assets. Any adjustments to such estimates will be made in the period such determination is made.
Based on the Company's evaluation, it has been concluded that there are no significant uncertain tax positions requiring recognition in the Company's financial statements. There were no amounts accrued for penalties or interest as of or during the periods presented in these consolidated financial statements. The Company does not expect its unrecognized tax benefit position to change during the next twelve months. Management is currently unaware of any issues under review that could result in significant payments, accruals or material deviations from its position.
As of December 31, 2010, the available-for-sale securities, at fair value, had a U.S. federal tax basis of approximately $1.4 billion.
Note 17. Earnings Per Share
The following table presents a reconciliation of the earnings and shares used in calculating basic and diluted earnings per share, or EPS, for the years ended December 31, 2010, 2009 and 2008:
| | | | | | | | | | | |
| Year Ended |
| December 31, |
(in thousands, except share data) | 2010 | | 2009 | | 2008 |
Numerator: | | | | | |
Net income (loss) to common stockholders for basic and diluted earnings per share | $ | 35,755 | | | $ | (8,837 | ) | | $ | 2,059 | |
Denominator: | | | | | |
Weighted average common shares outstanding | 22,340,975 | | | 22,937,782 | | | 24,936,558 | |
Weighted average restricted stock shares | 40,708 | | | 3,946 | | | — | |
Basic and diluted weighted average shares outstanding | 22,381,683 | | | 22,941,728 | | | 24,936,558 | |
Basic and Diluted Earnings (Loss) Per Share: | $ | 1.60 | | | $ | (0.39 | ) | | $ | 0.08 | |
For the years ended December 31, 2010 and 2009, the Company has assumed that no warrants would be exercised as
TWO HARBORS INVESTMENT CORP.
Notes to the Consolidated Financial Statements - (continued)
the market value per share of the Company's common stock was below the strike price of the warrants and the warrants would be anti-dilutive.
Note 18. Related Party Transactions
The following summary provides disclosure of the material transactions with affiliates of the Company.
In accordance with the Management Agreement with PRCM Advisers LLC, the Company incurred $3.0 million and $0.3 million as a management fee to PRCM Advisers LLC for the years ended December 31, 2010 and 2009, respectively, which represents approximately 1.5% of stockholders' equity on an annualized basis as defined by the Management Agreement. In addition, the Company reimbursed PRCM Advisers LLC for direct and allocated costs incurred by PRCM Advisers LLC on behalf of the Company. These direct and allocated costs totaled approximately $5.5 million and $4.9 million for the years ended December 31, 2010 and 2009, respectively.
The Company recognized $213,545 and $21,644 of compensation expense during the years ended December 31, 2010 and 2009, respectively, associated with the amortization of shares of restricted stock issued to the independent directors.
As of December 31, 2010 and 2009, there were 33,249,000 publicly-held registered warrants to purchase up to 33,249,000 shares of common stock issued and outstanding. Of the 33,249,000 warrants, 7,000,000 are beneficially owned by the founders of Capitol Acquisition Corp., or Capitol, the Company's TRS and 2,906,918 are beneficially owned by Nisswa Acquisition Master Fund Ltd., which is an investment fund managed by Pine River. The Company is required to maintain a resale registration statement for the warrants and common stock issuable upon exercise thereof that are held by the founders and Nisswa Acquisition Master Fund Ltd.
Note 19. Subsequent Events
Events subsequent to December 31, 2010 were evaluated through the date these financial statements were issued.
TWO HARBORS INVESTMENT CORP.
Notes to the Consolidated Financial Statements - (continued)
Note 20. Quarterly Financial Data - Unaudited
| | | | | | | | | | | | | | | |
| 2010 Quarter Ended |
(in thousands, except share data) | March 31 | | June 30 | | September 30 | | December 31 |
Interest income: | | | | | | | | | | | |
Available-for-sale securities | $ | 6,153 | | | $ | 9,088 | | | $ | 11,823 | | | $ | 12,780 | |
Trading securities | — | | | — | | | 15 | | | 155 | |
Cash and cash equivalents | 6 | | | 37 | | | 27 | | | 37 | |
Total interest income | 6,159 | | | 9,125 | | | 11,865 | | | 12,972 | |
Interest expense | 518 | | | 863 | | | 1,396 | | | 1,644 | |
Net interest income | 5,641 | | | 8,262 | | | 10,469 | | | 11,328 | |
Other income: | | | | | | | |
Gain on investment securities, net | 1,197 | | | 834 | | | 2,577 | | | 1,519 | |
Gain (loss) on interest rate swap agreements | (1,547 | ) | | (4,054 | ) | | (4,436 | ) | | 3,693 | |
Gain on other derivative instruments | 946 | | | 153 | | | 3,098 | | | 2,959 | |
Total other income (loss) | 596 | | | (3,067 | ) | | 1,239 | | | 8,171 | |
Expenses: | | | | | | | |
Management fees | 457 | | | 748 | | | 863 | | | 921 | |
Operating expenses | 987 | | | 1,132 | | | 1,213 | | | 1,246 | |
Total expenses | 1,444 | | | 1,880 | | | 2,076 | | | 2,167 | |
Net income before income taxes | 4,793 | | | 3,315 | | | 9,632 | | | 17,332 | |
Benefit from (provision for) income taxes | 535 | | | 774 | | | 246 | | | (872 | ) |
Net income | 5,328 | | | 4,089 | | | 9,878 | | | 16,460 | |
Accretion of trust account income relating to common stock subject to possible conversion | — | | | — | | | — | | | — | |
Net income attributable to common stockholders | $ | 5,328 | | | $ | 4,089 | | | $ | 9,878 | | | $ | 16,460 | |
Weighted average number of common shares outstanding, excluding shares subject to possible conversion - basic and diluted | 13,401,368 | | | 22,466,691 | | | 26,126,212 | | | 27,532,462 | |
Basic and diluted loss per share | $ | 0.40 | | | $ | 0.18 | | | $ | 0.38 | | | $ | 0.60 | |
TWO HARBORS INVESTMENT CORP.
Notes to the Consolidated Financial Statements - (continued)
| | | | | | | | | | | | | | | |
| 2009 Quarter Ended |
(in thousands, except share data) | March 31 | | June 30 | | September 30 | | December 31 |
Interest income: | | | | | | | | | | | |
Available-for-sale securities | $ | — | | | $ | — | | | $ | — | | | $ | 2,796 | |
Cash and cash equivalents | 49 | | | 7 | | | 1 | | | 13 | |
Total interest income | 49 | | | 7 | | | 1 | | | 2,809 | |
Interest expense | — | | | — | | | — | | | 131 | |
Net interest income | 49 | | | 7 | | | 1 | | | 2,678 | |
Other income: | | | | | | | |
Gain on investment securities, net | — | | | — | | | — | | | 336 | |
Gain (loss) on interest rate swap agreements | — | | | — | | | — | | | 364 | |
Gain on other derivative instruments | — | | | — | | | — | | | — | |
Total other income | — | | | — | | | — | | | 700 | |
Expenses: | | | | | | | |
Management fees | — | | | — | | | — | | | 326 | |
Operating expenses | 320 | | | 1,386 | | | 1,040 | | | 9,425 | |
Total expenses | 320 | | | 1,386 | | | 1,040 | | | 9,751 | |
Net income (loss) before income taxes | (271 | ) | | (1,379 | ) | | (1,039 | ) | | (6,373 | ) |
Benefit from (provision for) income taxes | 92 | | | 155 | | | 119 | | | (48 | ) |
Net income (loss) | (179 | ) | | (1,224 | ) | | (920 | ) | | (6,421 | ) |
Accretion of trust account income relating to common stock subject to possible conversion | (31 | ) | | (37 | ) | | (25 | ) | | — | |
Net income (loss) attributable to common stockholders | $ | (210 | ) | | $ | (1,261 | ) | | $ | (945 | ) | | $ | (6,421 | ) |
Weighted average number of common shares outstanding, excluding shares subject to possible conversion - basic and diluted | 24,936,558 | | | 24,936,558 | | | 24,936,558 | | | 16,935,316 | |
Basic and diluted loss per share | $ | (0.01 | ) | | $ | (0.05 | ) | | $ | (0.04 | ) | | $ | (0.38 | ) |
Item 9. Changes and Disagreements with Accountants on Accounting and Financial Disclosures
On October 30, 2009, the audit committee of the Board of Directors of the Company engaged Ernst & Young LLP as the principal accountant for Capitol. As a result of the Merger, Capitol became a wholly-owned subsidiary of the Company, for which Ernst & Young LLP serves as the principal accountant, and consequently Marcum LLP formerly known as Marcum & Kliegman LLP (“Marcum”) was effectively dismissed. Neither the Company's nor Capitol's Board of Directors recommended or approved such decision by the audit committee; however, the Company's Board of Directors has delegated to the audit committee, which is comprised of all of the Company's independent directors, the authority to engage independent certified public accountants. Marcum's report in respect of the audited financial statements of Capitol as of December 31, 2008 and 2007, and for the year ended December 31, 2008 and for the periods June 26, 2007 (inception) through December 31, 2007 and 2008 included an explanatory paragraph relating to substantial doubt about the ability of Capitol to continue as a going concern as described in Note 1 to such financial statements. During Capitol's two most recent fiscal years and the subsequent interim periods prior to October 30, 2009, neither the Company nor Capitol had any disagreements with Marcum on any matter of accounting principle or practice, financial statement disclosure or auditing scope or procedure.
Item 9A. Controls and Procedures
A review and evaluation was performed by our management, including our Chief Executive Officer, or CEO, and Chief Financial Officer, or CFO, of the effectiveness of our disclosure controls and procedures (as such term is defined in Rule 13a-15(e) and 15d-15(e) under the 1934 Act) as of the end of the period covered by this Annual Report on Form 10-K. Based on that review and evaluation, the CEO and CFO have concluded that our current disclosure controls and procedures, as designed and implemented, were effective. Notwithstanding the foregoing, a control system, no matter how well designed and operated, can provide only reasonable, not absolute, assurance that it will detect or uncover failures within the Company to disclose material information otherwise required to be set forth in our periodic reports.
There have been no changes in our internal control over financial reporting that occurred during the year ended December 31, 2010 that have materially affected, or are reasonably likely to materially affect, our internal control over financial reporting.
Management's Report On Internal Control Over Financial Reporting
Management of the Company is responsible for establishing and maintaining adequate internal control over financial reporting for the Company. Internal control over financial reporting is defined in Rules 13a-15(f) and 15d-15(f) promulgated under the 1934 Act as a process designed by, or under the supervision of, the Company's principal executive and principal financial officers and effected by the Company's Board, management and other personnel to provide reasonable assurance regarding the reliability of financial reporting and the preparation of financial statements for external purposes in accordance with GAAP and includes those policies and procedures that:
| |
• | pertain to the maintenance of records that in reasonable detail accurately and fairly reflect the transactions and dispositions of the assets of the Company; |
| |
• | provide reasonable assurance that transactions are recorded as necessary to permit preparation of financial statements in accordance with GAAP, and that receipts and expenditures of the Company are being made only in accordance with authorizations of management and directors of the Company; and |
| |
• | provide reasonable assurance regarding prevention or timely detection of unauthorized acquisition, use or disposition of the Company's assets that could have a material effect on the financial statements. |
Because of its inherent limitations, internal control over financial reporting may not prevent or detect misstatements. Projections of any evaluation of effectiveness to future periods are subject to the risks that controls may become inadequate because of changes in conditions or that the degree of compliance with the policies or procedures may deteriorate.
The Company's management assessed the effectiveness of the Company's internal control over financial reporting as of December 31, 2010. In making this assessment, the Company's management used criteria set forth by the Committee of Sponsoring Organizations of the Treadway Commission in Internal Control-Integrated Framework.
Based on its assessment, the Company's management believes that, as of December 31, 2010, the Company's internal control over financial reporting was effective based on those criteria.
The Company's independent auditors, Ernst & Young LLP, have issued an attestation report on the effectiveness of the Company's internal control over financial reporting. This report appears on page 97 of this annual report on Form 10-K.
Report of Independent Registered Public Accounting Firm
The Board of Directors and Stockholders
of Two Harbors Investment Corp.
We have audited Two Harbors Investment Corp.'s internal control over financial reporting as of December 31, 2010, based on criteria established in Internal Control - Integrated Framework issued by the Committee of Sponsoring Organizations of the Treadway Commission (the COSO criteria). Two Harbors Investment Corp.'s management is responsible for maintaining effective internal control over financial reporting, and for its assessment of the effectiveness of internal control over financial reporting included in the accompanying Management's Report On Internal Control Over Financial Reporting. Our responsibility is to express an opinion on the Company's internal control over financial reporting based on our audit.
We conducted our audit in accordance with the standards of the Public Company Accounting Oversight Board (United States). Those standards require that we plan and perform the audit to obtain reasonable assurance about whether effective internal control over financial reporting was maintained in all material respects. Our audit included obtaining an understanding of internal control over financial reporting, assessing the risk that a material weakness exists, testing and evaluating the design and operating effectiveness of internal control based on the assessed risk, and performing such other procedures as we considered necessary in the circumstances. We believe that our audit provides a reasonable basis for our opinion.
A company's internal control over financial reporting is a process designed to provide reasonable assurance regarding the reliability of financial reporting and the preparation of financial statements for external purposes in accordance with generally accepted accounting principles. A company's internal control over financial reporting includes those policies and procedures that (1) pertain to the maintenance of records that, in reasonable detail, accurately and fairly reflect the transactions and dispositions of the assets of the company; (2) provide reasonable assurance that transactions are recorded as necessary to permit preparation of financial statements in accordance with generally accepted accounting principles, and that receipts and expenditures of the company are being made only in accordance with authorizations of management and directors of the company; and (3) provide reasonable assurance regarding prevention or timely detection of unauthorized acquisition, use, or disposition of the company's assets that could have a material effect on the financial statements.
Because of its inherent limitations, internal control over financial reporting may not prevent or detect misstatements. Also, projections of any evaluation of effectiveness to future periods are subject to the risk that controls may become inadequate because of changes in conditions, or that the degree of compliance with the policies or procedures may deteriorate.
In our opinion, Two Harbors Investment Corp. maintained, in all material respects, effective internal control over financial reporting as of December 31, 2010, based on the COSO criteria.
We also have audited, in accordance with the standards of the Public Company Accounting Oversight Board (United States), the consolidated balance sheets of Two Harbors Investment Corp. as of December 31, 2010 and 2009, and the related consolidated statements of income (loss), stockholders' equity and comprehensive income (loss), and cash flows for the years then ended of Two Harbors Investment Corp. and our report dated March 4, 2011 expressed an unqualified opinion thereon.
/s/ Ernst & Young LLP
Ernst & Young LLP
Minneapolis, Minnesota
March 4, 2011
Item 9B. Other Information
None.
PART III
Items 10, 11, 12, and 13.
The information required by Items 10, 11, 12, and 13 of Part III of this Annual Report is incorporated by reference to information to be set forth in the Company's definitive Proxy Statement for its 2011 Annual Meeting of Stockholders, which will be filed with the Securities and Exchange Commission, pursuant to Regulation 14A, not later than 120 days after the end of the fiscal year.
Item 14. Principal Accounting Fees and Services
We retained Ernst & Young LLP (E&Y) to audit our consolidated financial statements for the year ended December 31, 2010. We also retained E&Y, as well as other accounting and consulting firms, to provide various other services in 2010.
The aggregate fee incurred by us for professional services performed by E&Y were as follows for the years ended December 31, 2010 and December 31, 2009:
| | | | | | | |
| Year Ended December 31, |
| 2010 | | 2009 |
Audit fees(a) | $ | 345,000 | | | $ | 270,000 | |
Audit-related fees(b) | 262,950 | | | 146,900 | |
Tax fees(c) | 187,500 | | | 122,000 | |
Other fees(d) | 1,995 | | | — | |
Total principal accountant fees | $ | 797,445 | | | $ | 538,900 | |
____________________
| |
(a) | Audit Fees pertain to the audit of our annual Consolidated Financial Statements, including review of the interim financial statements contained in our Quarterly Reports on Form 10-Q, comfort letters to underwriters in connection with our merger transaction and stock registration, attest services, consents to the incorporation of the E&Y audit report in publicly filed documents and assistance with and review of documents filed with the SEC. |
| |
(b) | Audit-Related Fees pertain to assurance and related services that are traditionally performed by the principal accountant, including accounting consultations and audits in connection with proposed or consummated acquisitions, internal control reviews and consultation concerning financial accounting and reporting standards. |
| |
(c) | Tax Fees pertain to services performed for tax compliance, including REIT compliance, tax planning and tax advice, including preparation of tax returns and claims for refund and tax-payment planning services. Tax planning and advice also includes assistance with tax audits and appeals, and tax advice related to specific transactions. |
| |
(d) | Other Fees pertain to annual membership fees to E&Y's online accounting research tool. |
The services performed by E&Y for 2010 were pre-approved in accordance with the pre-approval policy of our Audit Committee. This policy requires that all engagement fees and the terms and scope of all auditing and non-auditing services be reviewed and approved by the Audit Committee in advance of their formal initiation.
PART IV
Item 15. Exhibits, Financial Statement Schedules
(a) The following documents are filed as part of this Annual Report of Form 10-K:
(1)Consolidated Financial Statements:
The consolidated financial statements of the Company, together with the independent registered public accounting firm's report thereon, are set forth in Part II, Item 8 on pages 61 through 67 of this Annual Report on Form 10-K and are incorporated herein by reference. (2)Schedules to Consolidated Financial Statements:
All Consolidated Financial Statements schedules not included have been omitted because they are either inapplicable or the information required is provided in the Company's Consolidated Financial Statements and Notes thereto, included in Part II, Item 8, of this Annual Report on Form 10-K.
(3)Exhibits:
The exhibits listed on the accompanying Exhibits Index are filed or incorporated by reference as part of this Annual Report on Form 10-K.
| | |
Exhibit Number | | Exhibit Index |
2.1 | | Agreement and Plan of Merger, dated as of June 11, 2009, by and among Capitol Acquisition Corp., Two Harbors Investment Corp., Two Harbors Merger Corp. and Pine River Capital Management L.P. (incorporated by reference to Annex A filed with Pre Effective Amendment No. 4 to the Registrant's Registration Statement on Form S-4 (File No. 333-160199) filed with the Securities and Exchange Commission on October 8, 2009 (“Amendment No. 4”)). |
2.2 | | Amendment No. 1 to Agreement and Plan of Merger, dated as of August 17, 2009, by and among Capitol Acquisition Corp., Two Harbors Investment Corp., Two Harbors Merger Corp. and Pine River Capital Management L.P. (incorporated by reference to Annex A-2 filed with Amendment No. 4). |
2.3 | | Amendment No. 2 to Agreement and Plan of Merger, dated as of September 20, 2009, by and among Capitol Acquisition Corp., Two Harbors Investment Corp., Two Harbors Merger Corp. and Pine River Capital Management L.P. (incorporated by reference to Annex A-3 filed with Amendment No. 4). |
3.1 | | Articles of Amendment and Restatement of Two Harbors Investment Corp. (incorporated by reference to Annex B filed with Amendment No. 4). |
3.2 | | Bylaws of Two Harbors Investment Corp. (incorporated by reference to Annex C filed with Amendment No. 4). |
4.1 | | Warrant Agreement between Continental Stock Transfer & Trust Company and Capitol Acquisition Corp. (incorporated by reference to Exhibit 4.1 to the Registrant's Annual Report on Form 10-K for the fiscal year ended December 31, 2009, filed with the Securities and Exchange Commission on March 4, 2010 ("2010 Form 10-K")). |
4.2 | | Specimen Common Stock Certificate of Two Harbors Investment Corp. (incorporated by reference to Exhibit 4.2 to Amendment No. 4). |
4.3 | | Specimen Warrant Certificate of Two Harbors Investment Corp. (incorporated by reference to Exhibit 4.3 filed with Pre-Effective Amendment No. 1 to the Registrant's Registration Statement on Form S-4 (File No. 333-160199) filed with the Securities and Exchange Commission on August 5, 2009). |
4.4 | | Supplement and Amendment to Warrant Agreement between Continental Stock Transfer & Trust Company, Capitol Acquisition Corp. and Two Harbors Investment Corp. (incorporated by reference to Exhibit 4.4 to the Registrant's 2010 Form 10-K). |
4.5 | | Second Amendment to Warrant Agreement between Two Harbors Investment Corp. and Mellon Investors Services LLC (incorporated by reference to Exhibit 99.1 to the Registrant's Current Report on Form 8-K filed with the Securities and Exchange Commission on December 13, 2010). |
10.1 | | Management Agreement (incorporated by reference to Exhibit 10.1 to the Registrant's 2010 Form 10-K). |
10.2 | | Sponsor's Voting and Support Agreement (incorporated by reference to Exhibit 10.2 to the Registrant's 2010 Form 10-K).(1) |
10.3 | | Sub-Management Agreement (incorporated by reference to Exhibit 10.3 to the Registrant's 2010 Form 10-K). |
10.4 | | Shared Facilities and Services Agreement (incorporated by reference to Exhibit 10.4 to the Registrant's 2010 Form 10-K). |
10.5* | | 2009 Equity Incentive Plan (incorporated by reference to Exhibit 10.9 to Amendment No. 4). |
10.6* | | Form of Restricted Common Stock Award (incorporated by reference to Exhibit 10.10.1 to Amendment No. 4). |
10.7* | | Form of Phantom Share Award (incorporated by reference to Exhibit 10.10.2 to Amendment No. 4). |
10.8 | | Letter agreement, dated June 10, 2009, between Capitol Acquisition Corp. and Citigroup Global Markets Inc. (incorporated by reference to Exhibit 10.4 filed with Capitol Acquisition Corp.'s Current Report on Form 8-K/A filed with the Securities and Exchange Commission on August 21, 2009). |
10.9 | | Registration Rights Agreement, dated as of October 28, 2009, by and among Two Harbors Investment Corp., Capitol Acquisition Corp. and certain persons listed on Schedule 1 thereto (incorporated by reference to Exhibit 10.1 to the Registrant's Current Report on Form 8-K filed with the Securities and Exchange Commission on October 28, 2009 (“Merger Closing 8-K”)). |
| | |
Exhibit Number | | Exhibit Index |
10.10 | | Letter Agreement, dated as of October 28, 2009, by and between Two Harbors Investment Corp. and Integrated Holding Group LP (incorporated by reference to Exhibit 10.2 to the Merger Closing 8-K). |
10.11 | | Letter Agreement, dated as of October 27, 2009, by and among Two Harbors Investment Corp., Federated Kaufmann Fund, Federated Kaufmann Fund II and Federated Kaufmann Growth Fund (incorporated by reference to Exhibit 10.3 to the Merger Closing 8-K). |
10.12 | | Letter Agreement, dated as of October 28, 2009, by and between Two Harbors Investment Corp. and Whitebox Special Opportunities Fund, LP Series A (incorporated by reference to Exhibit 10.4 to the Merger Closing 8-K). |
10.13 | | Letter Agreement, dated as of October 28, 2009, by and between Capitol Acquisition Corp., Two Harbors Investment Corp. and Ladenburg Thalmann & Co. Inc. (incorporated by reference to Exhibit 10.5 to the Merger Closing 8-K). |
10.14 | | Form of Indemnification Agreement (incorporated by reference to Exhibit 10.1 to the Current Report on the Form 8-K filed with the Securities and Exchange Commission on November 19, 2009). |
10.15 | | Master Repurchase and Securities Contract dated August 4, 2010 between Two Harbors Asset I, LLC and Wells Fargo Bank, National Association (incorporated by reference to Exhibit 99.1 to the Current Report on Form 8-K filed with the Securities and Exchange Commission on August 5, 2010). |
10.16 | | Amendment Number 1 to Master Repurchase and Securities Contract dated November 15, 2010 between Two Harbors Asset I, LLC and Wells Fargo Bank, National Association (filed herewith). |
10.17 | | Guaranty Agreement dated August 4, 2010 between Two Harbors Investment Corp. in favor of Wells Fargo Bank, National Association (incorporated by reference to Exhibit 99.2 to the Current Report on Form 8-K filed with the Securities and Exchange Commission on August 5, 2010). |
10.18 | | Amendment Number 1 to Guaranty Agreement dated November 15, 2010 between Two Harbors Investment Corp. in favor of Wells Fargo Bank, National Association (filed herewith). |
21.1 | | Subsidiaries of registrant (filed herewith) |
23.1 | | Consent of Ernst & Young LLP (filed herewith) |
23.2 | | Consent of Marcum LLP (filed herewith) |
31.1 | | Certification of the Chief Financial Officer, pursuant to 18 U.S.C. Section 1350, as adopted pursuant to Section 302 of the Sarbanes-Oxley Act of 2002. (filed herewith) |
31.2 | | Certification of the Chief Financial Officer, pursuant to 18 U.S.C. Section 1350, as adopted pursuant to Section 302 of the Sarbanes-Oxley Act of 2002. (filed herewith) |
32.1 | | Certification of the Chief Executive Officer, pursuant to 18 U.S.C. Section 1350, as adopted pursuant to Section 906 of the Sarbanes-Oxley Act of 2002. (filed herewith) |
32.2 | | Certification of the Chief Executive Officer, pursuant to 18 U.S.C. Section 1350, as adopted pursuant to Section 906 of the Sarbanes-Oxley Act of 2002. (filed herewith) |
____________________
* Management contract or compensatory agreement.
| |
(1) | Two Harbors Investment Corp. is also a party to Sponsor's Voting and Support Agreements (“Agreements”) with each of the following Sponsors: Arno Penzias, Brooke Coburn, Capitol Acquisition Management LLC, Hugh Panero, Jeong Kim, Lawrence Calcano, Mark Ein, Miles Gilburne, Piyush Sodha, Richard Donaldson, Raul Fernandez, Thomas Wheeler, Ted Leonsis, and ZG Ventures LLC. In each case, the Agreements differ from Exhibit 10.2 with respect to the identity and notice address of the Sponsor. In some cases, the Sponsor has not provided a notice address. The Agreements with Capitol Acquisition Management LLC and ZG Ventures LLC contain an additional representation in Section 3.1(a), which is not found in Exhibit 10.2, regarding the good standing of the Sponsor and due authorization to enter into the Agreement. In all other material respects, the Agreements are substantially identical to Exhibit 10.2. |
SIGNATURES
Pursuant to the requirements of Section 13 or 15(d) of the Securities Exchange Act of 1934, the registrant has duly caused this report to be signed on its behalf by the undersigned, thereunto duly authorized.
| | | |
| | | TWO HARBORS INVESTMENT CORP. |
Dated: | March 4, 2011 | By: | /s/ Thomas Siering |
| | | Thomas Siering Chief Executive Officer, President and Director (principal executive officer) |
Pursuant to the requirements of the Securities Exchange Act of 1934, this report has been signed below by the following persons on behalf of the registrant and in the capacities and on the dates indicated.
| | | | |
Signature | | Title | | Date |
/s/ Thomas Siering | | Chief Executive Officer, President and
Director (principal executive officer) | | March 4, 2011 |
Thomas Siering | | | |
| | | | |
/s/ Jeffrey Stolt | | Chief Financial Officer and Treasurer (principal accounting and financial officer) | | March 4, 2011 |
Jeffrey Stolt | | | |
| | | | |
/s/ Brian C. Taylor | | Chairman of the Board of Directors | | March 4, 2011 |
Brian C. Taylor | | | |
| | | | |
/s/ Mark D. Ein | | Non-Executive Vice Chairman of the Board of Directors | | March 4, 2011 |
Mark D. Ein | | | |
| | | | |
/s/ Stephen G. Kasnet | | Director | | March 4, 2011 |
Stephen G. Kasnet | | | |
| | | | |
/s/ William W. Johnson | | Director | | March 4, 2011 |
William W. Johnson | | | |
| | | | |
/s/ W. Reid Sanders | | Director | | March 4, 2011 |
W. Reid Sanders | | | |
| | | | |
/s/ Peter Niculescu | | Director | | March 4, 2011 |
Peter Niculescu | | | |